Investment Properties in Lehi, Utah
240 active or under-contract listings in Lehi, Utah.
Asking prices for Lehi investment property currently run from $49,500 to $14.90M. Every listing below includes a proforma and gross-yield analysis so you can underwrite it before you call.
Lehi investment property market
Lehi, Utah has 240 investment listings currently active or under contract on UtahInvestor.com. The median asking price is $632,400. An average reported cap rate is not currently available.
Figures reflect current listing records, not closed sales or the entire rental market. Cap rates depend on reported income and expenses; verify each property’s financials before investing. Listings under contract may not be available for purchase.
Current listings
240
Median price
$632,400
Avg reported cap rate
—
Avg units
1.0
Current listings
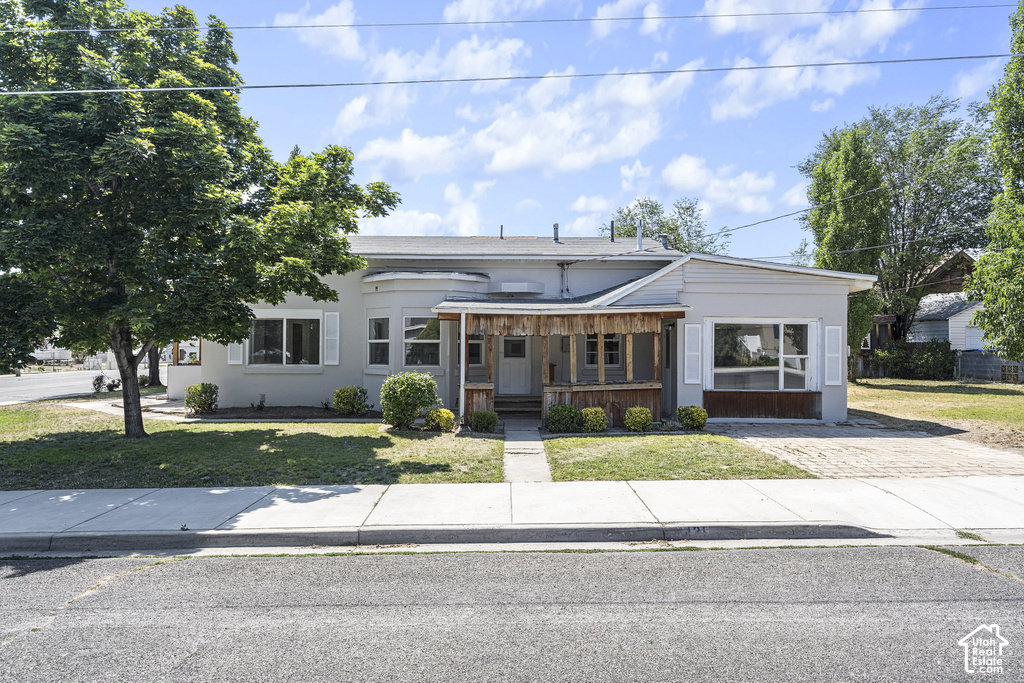
$519,000
189 E 400 N
2 units · 4 bd · 2 ba · 2,068 sqft
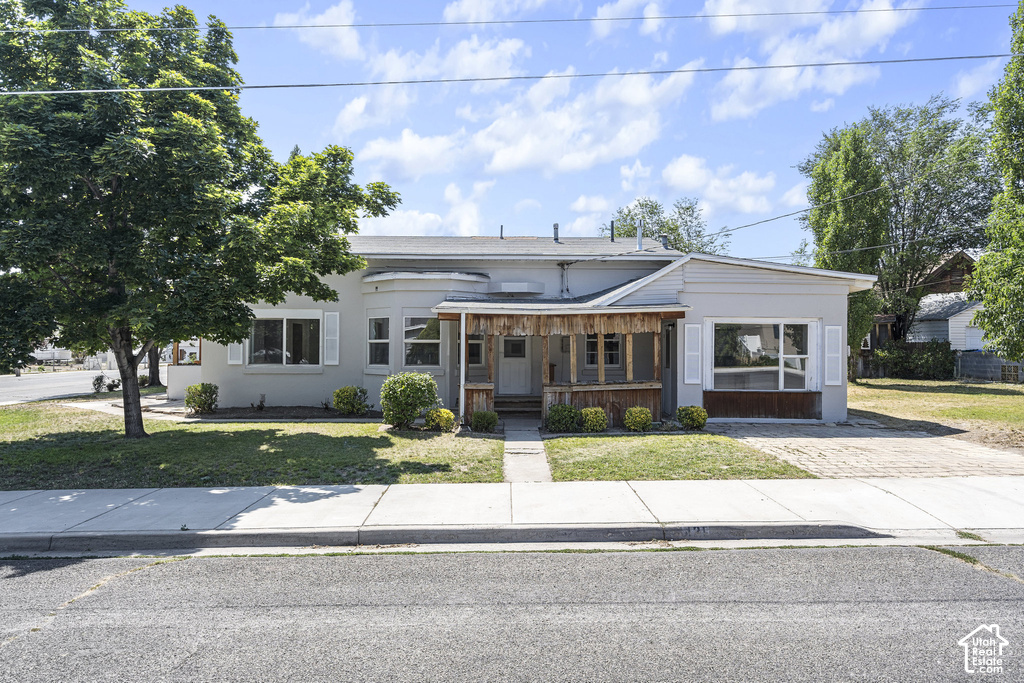
$519,000
189 E 400 N
4 bd · 3 ba · 2,068 sqft
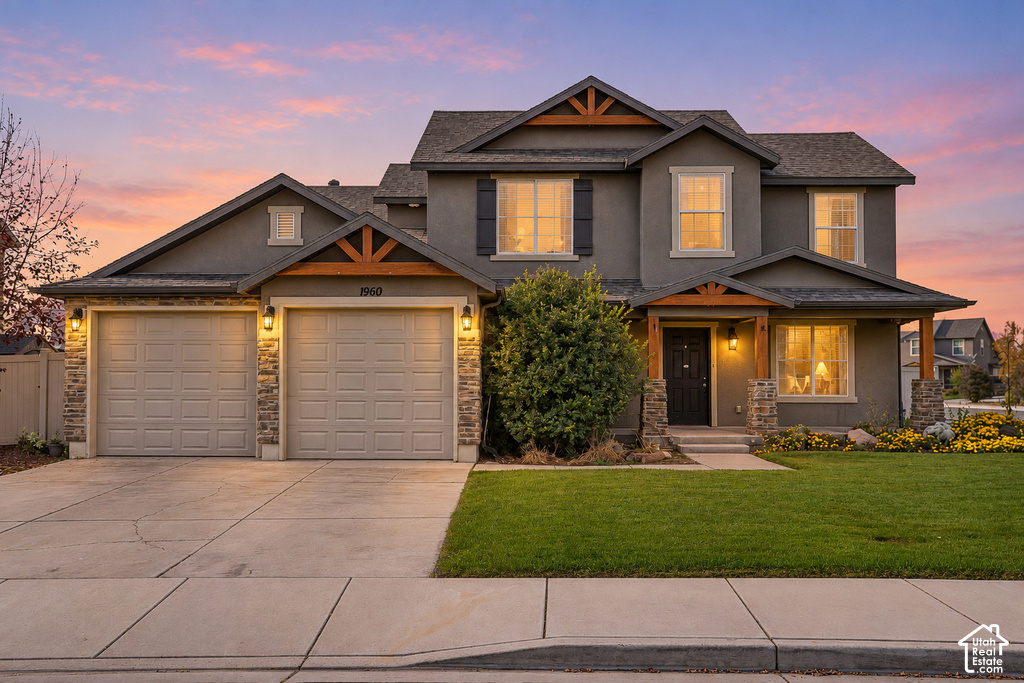
$600,000
1960 S MEADOW MARSH E DR
5 bd · 3 ba · 2,545 sqft
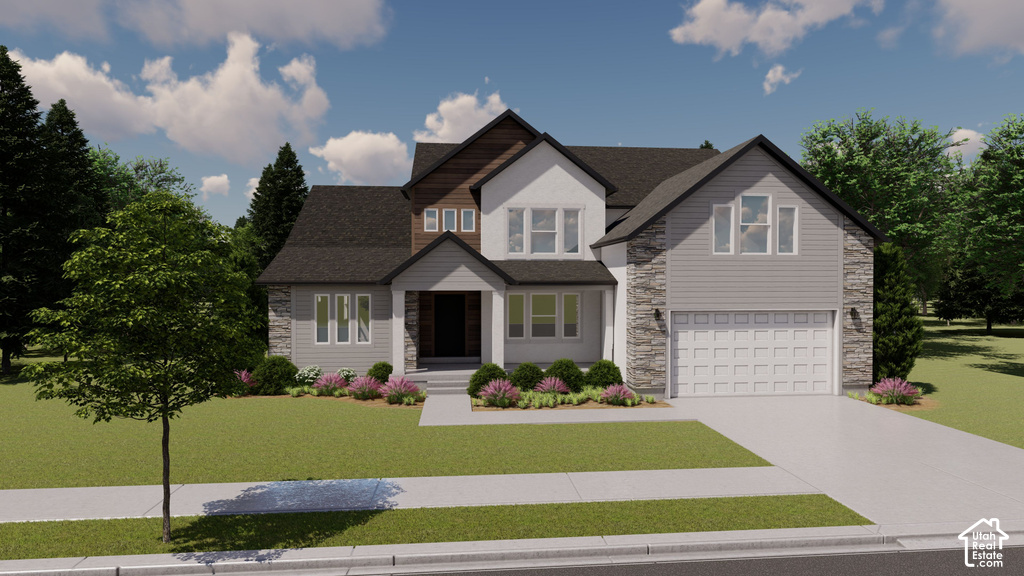
$1.10M
2538 W 400 S
4 bd · 3 ba · 4,980 sqft
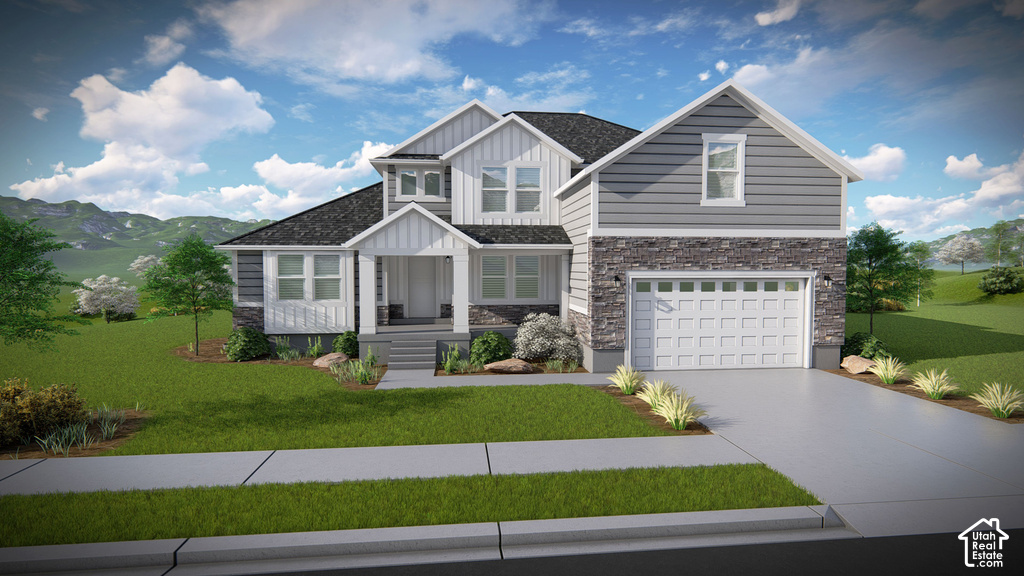
$1.10M
423 S 2500 W
4 bd · 3 ba · 4,644 sqft
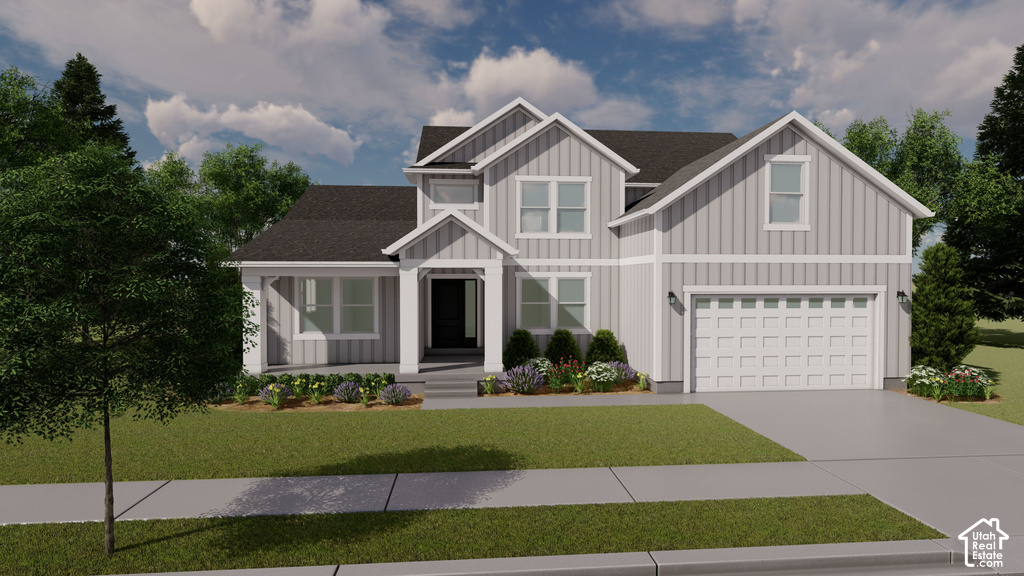
$1.03M
2634 W 400 S
4 bd · 3 ba · 4,562 sqft
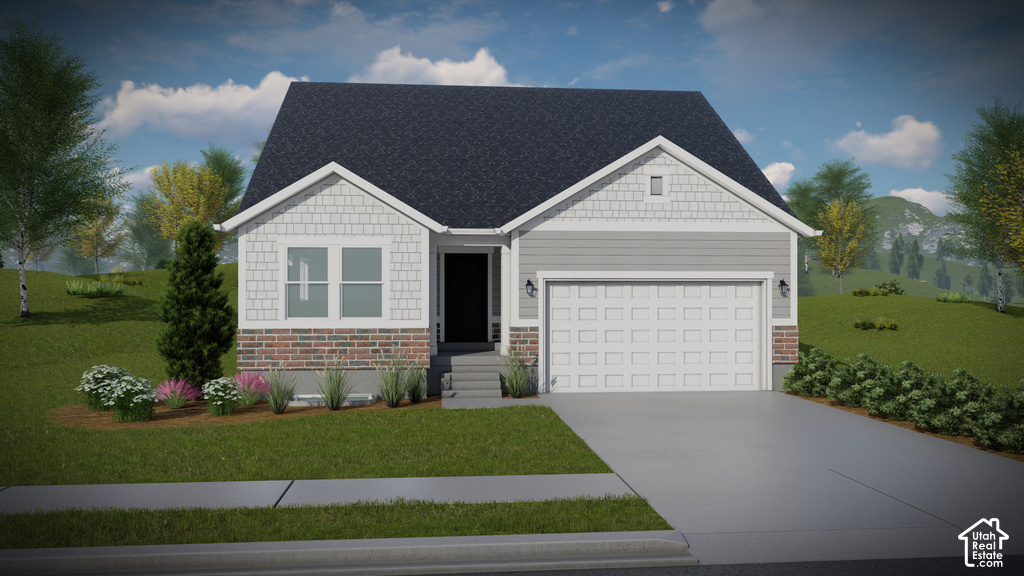
$671,900
1093 N 3570 W
5 bd · 3 ba · 3,270 sqft
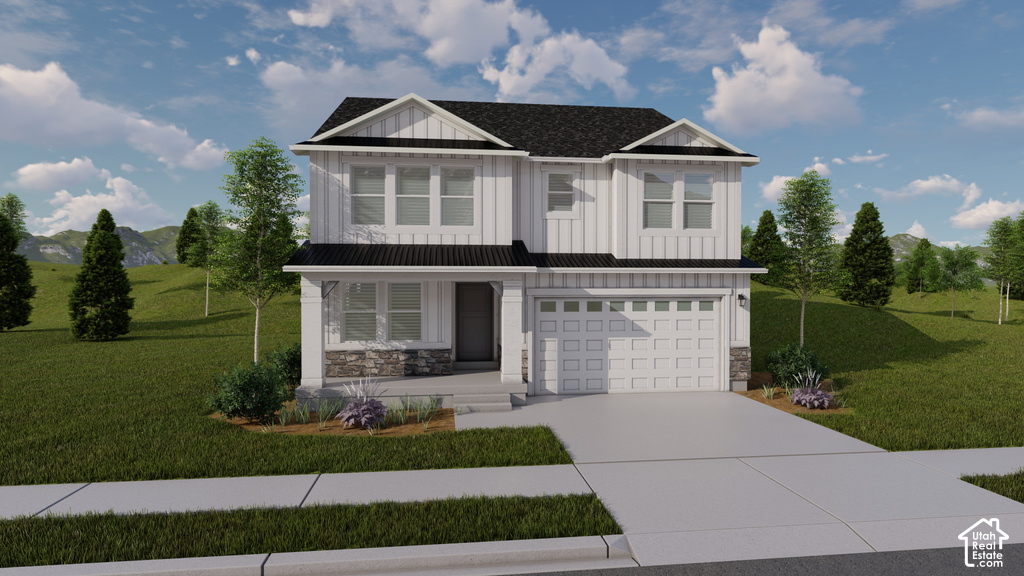
$739,900
858 N PARK DR
3 bd · 3 ba · 3,584 sqft
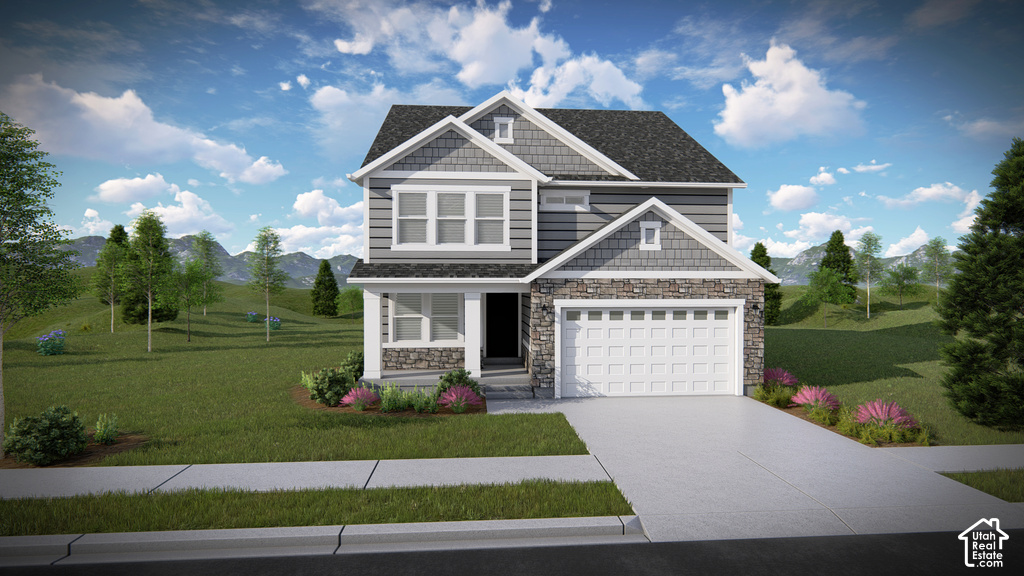
$711,900
1057 N 3570 W
3 bd · 3 ba · 3,623 sqft
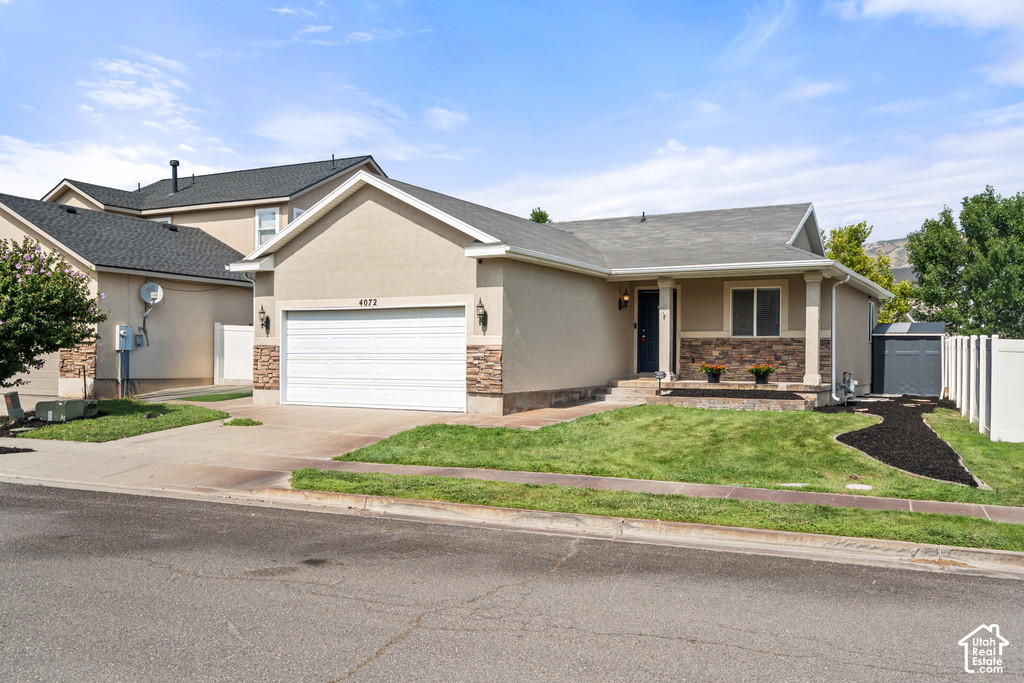
$470,000
4072 N BOUNTY CV
4 bd · 2 ba · 2,128 sqft
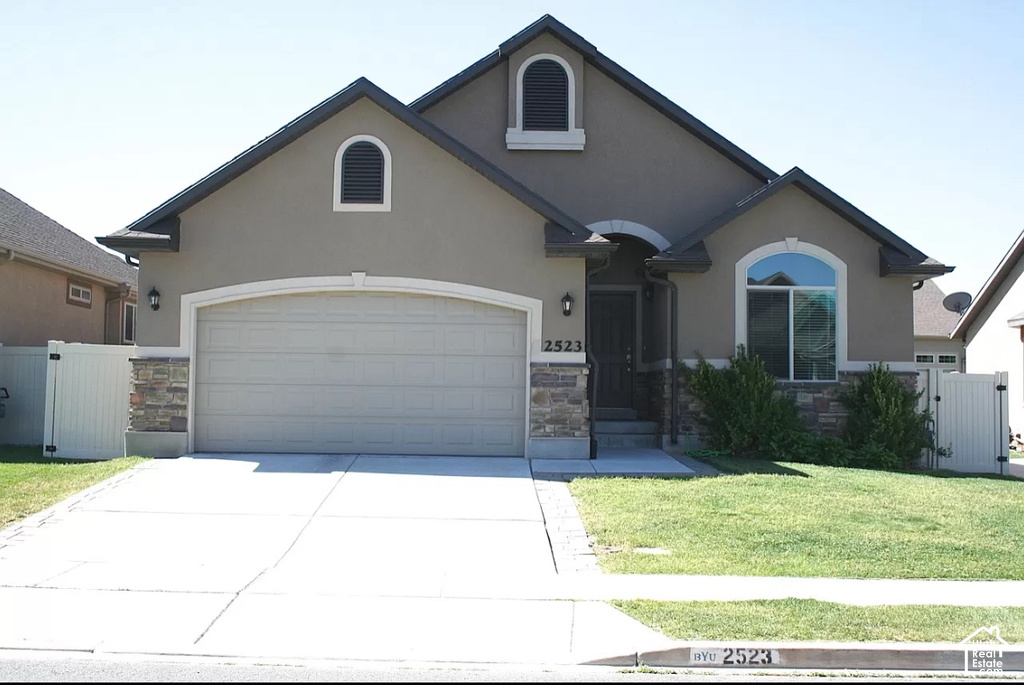
$589,900
2523 W 2300 N DR
3 bd · 2 ba · 2,791 sqft
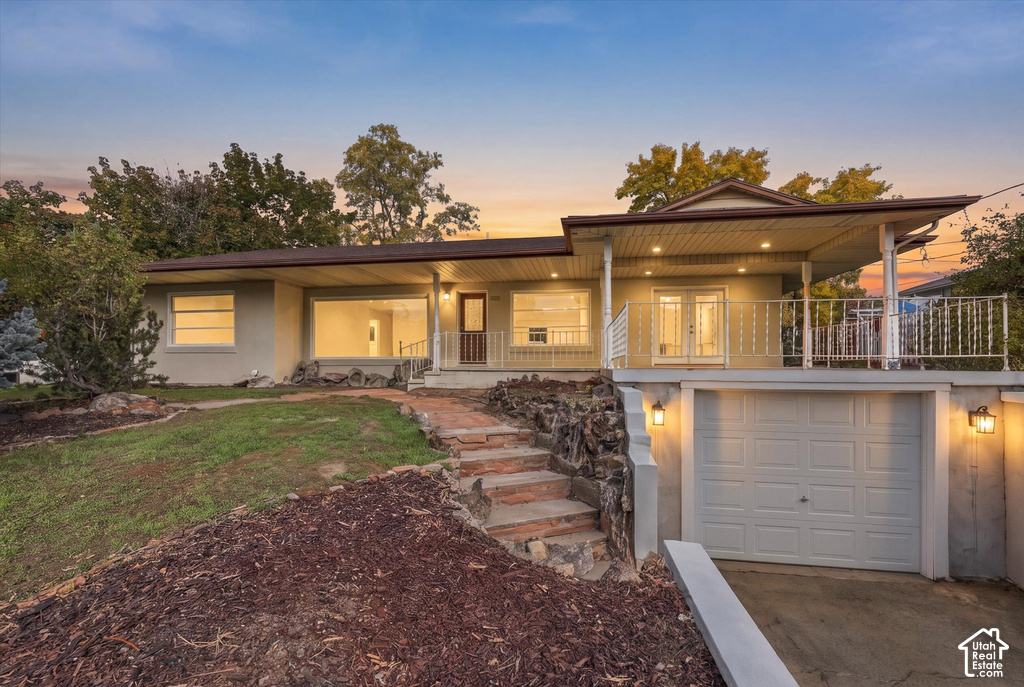
$624,999
1175 E 900 N
3 bd · 3 ba · 3,708 sqft
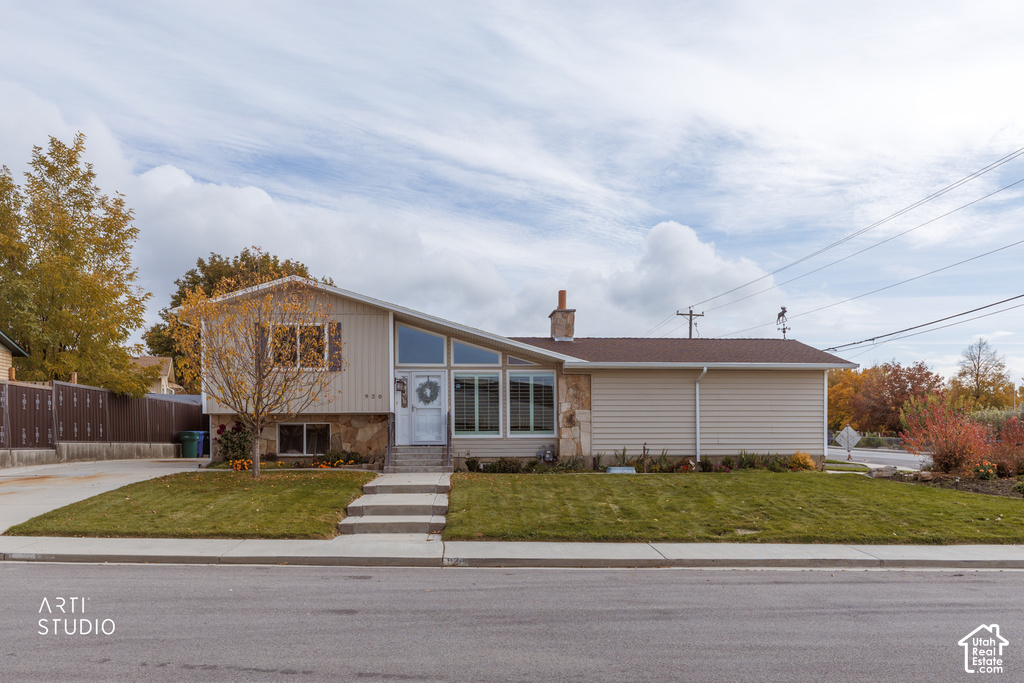
$559,000
920 N 940 E
4 bd · 2 ba · 2,720 sqft
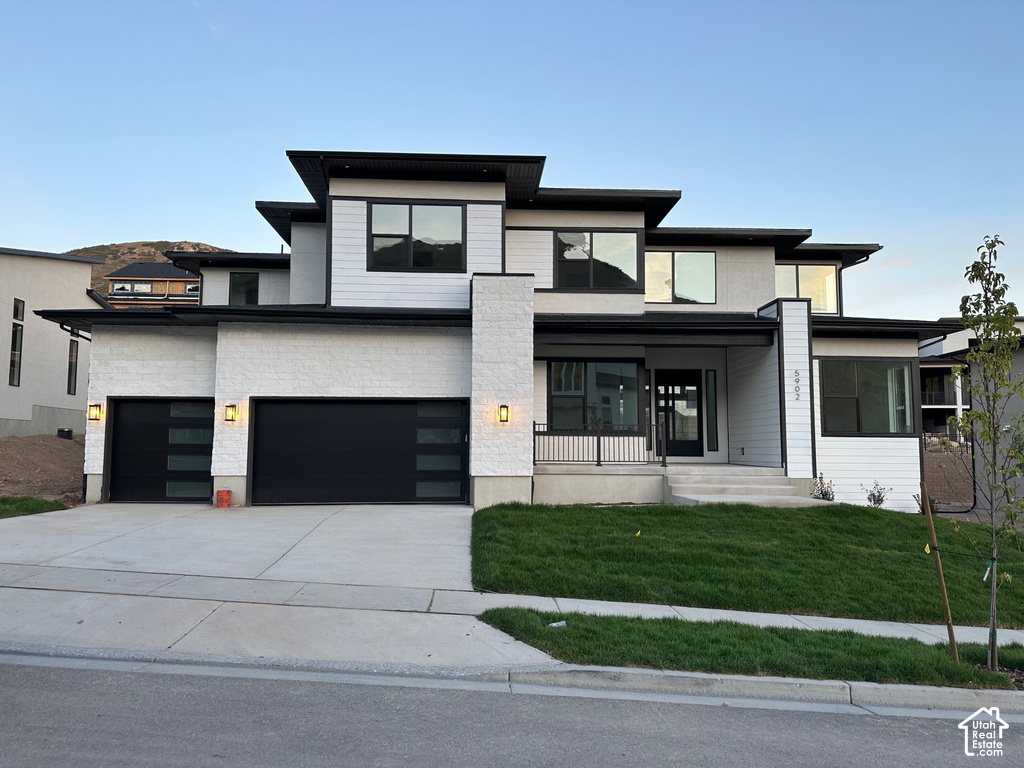
$1.65M
5902 N FOX CANYON RD
4 bd · 4 ba · 6,215 sqft
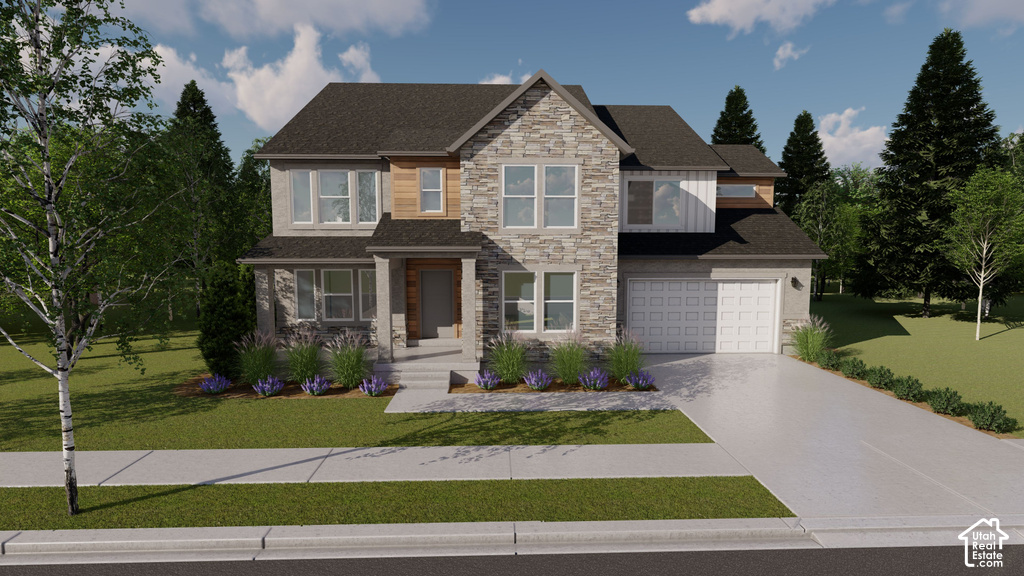
$912,900
354 S 2710 W ST
4 bd · 3 ba · 4,650 sqft
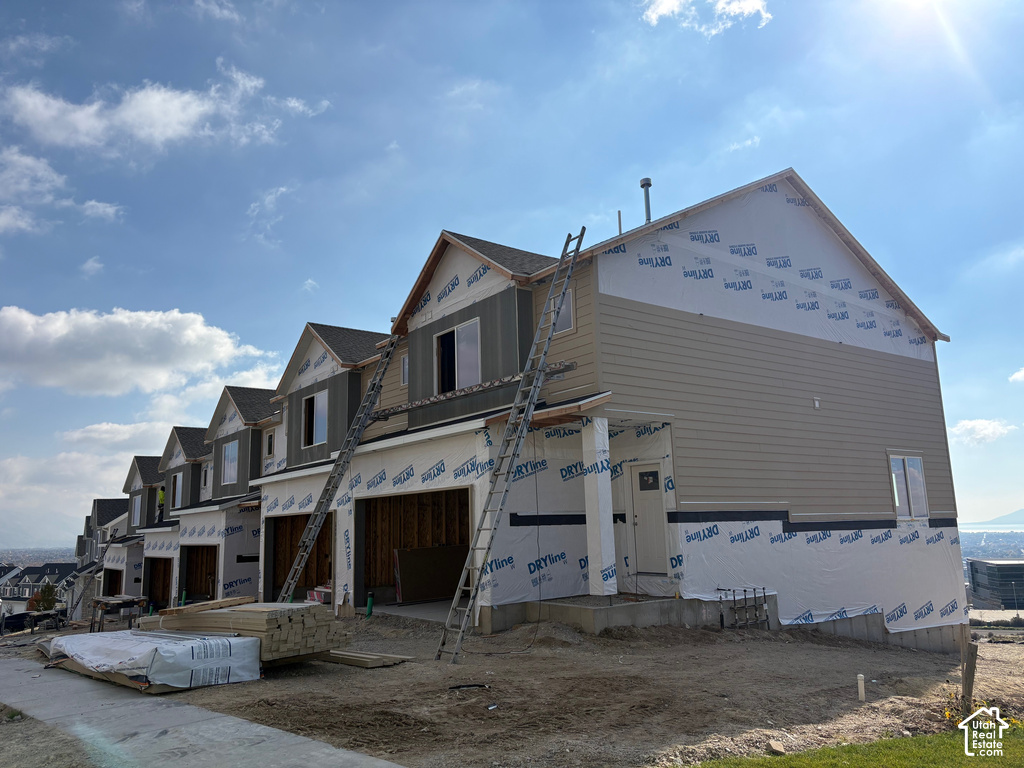
$560,500
1103 W VISTA RIDGE DR
3 bd · 3 ba · 2,359 sqft
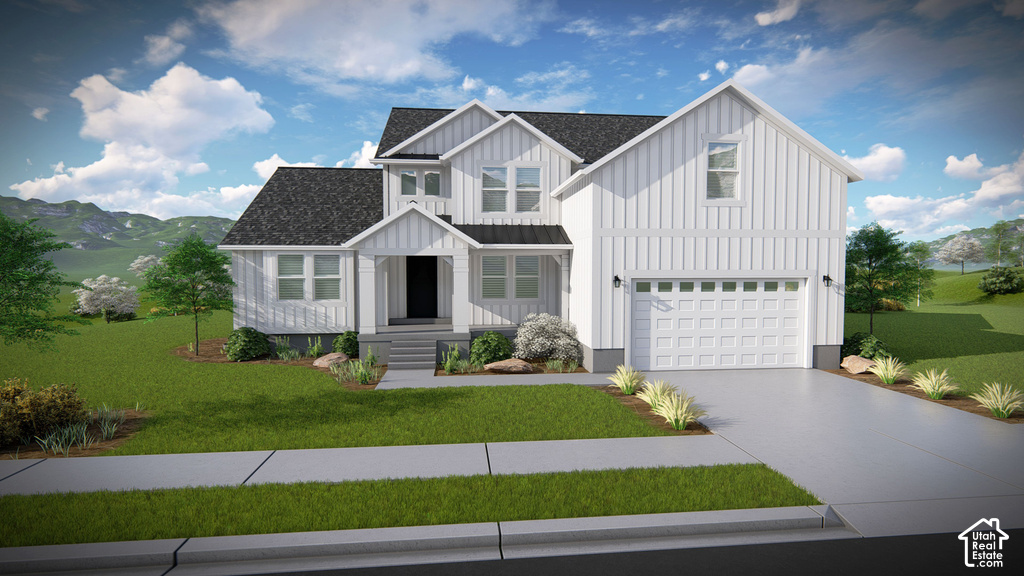
$896,900
332 S 2710 W ST
4 bd · 3 ba · 4,644 sqft
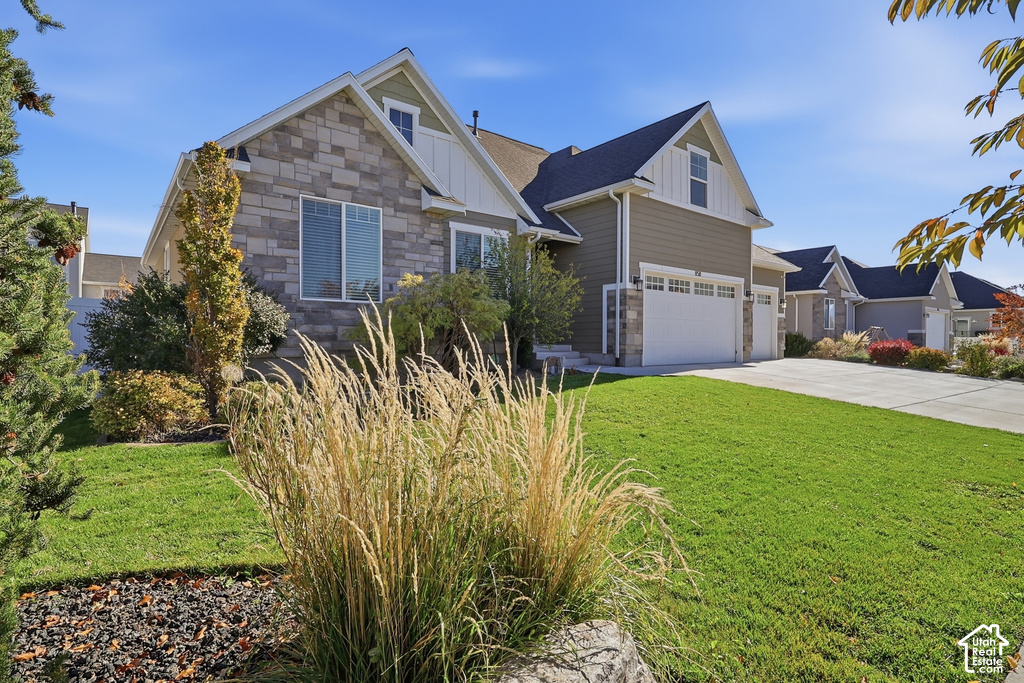
$899,900
858 N LEO W LN
6 bd · 4 ba · 4,121 sqft
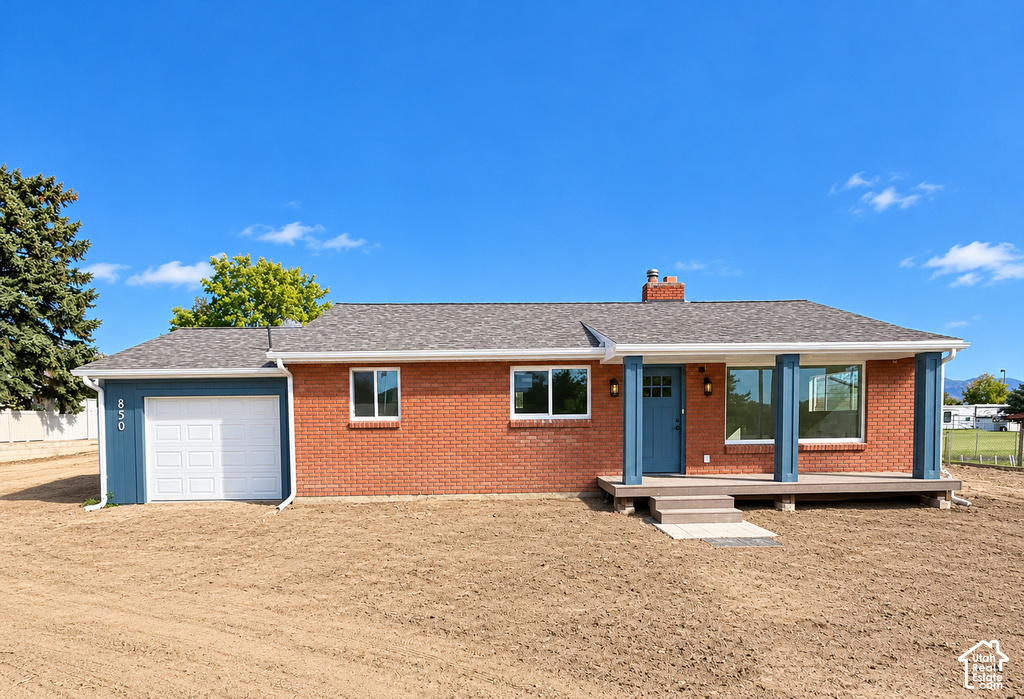
$620,000
850 N 1200 E
4 bd · 3 ba · 2,240 sqft
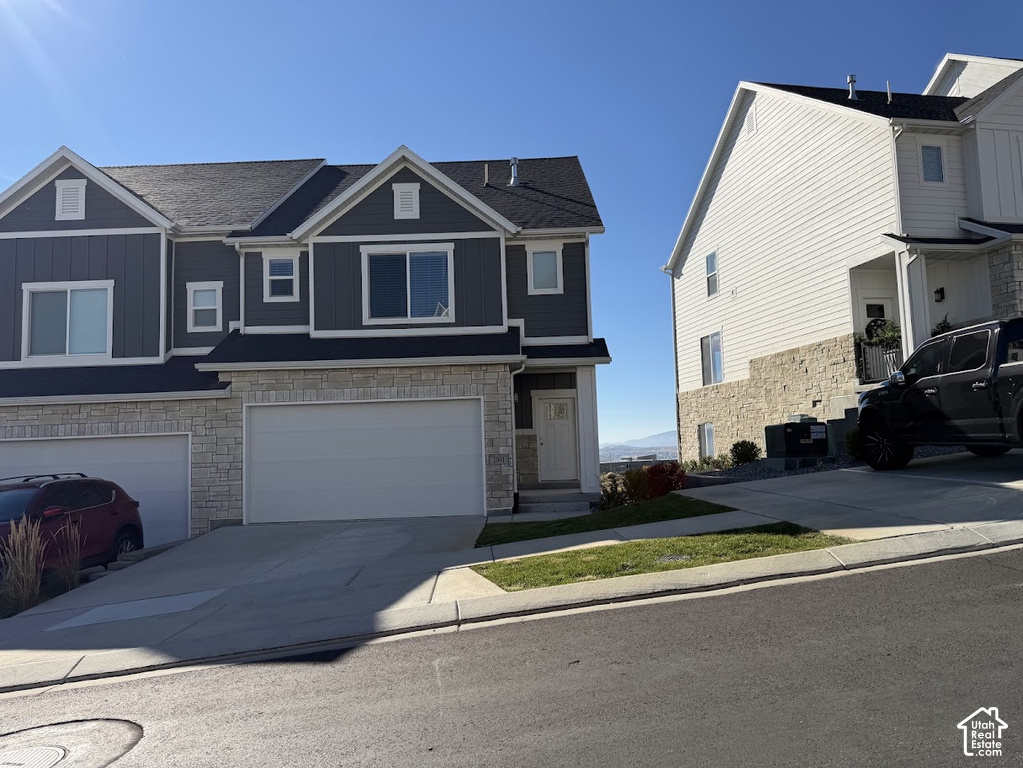
$565,500
1115 W VISTA RIDGE N DR
3 bd · 3 ba · 2,359 sqft
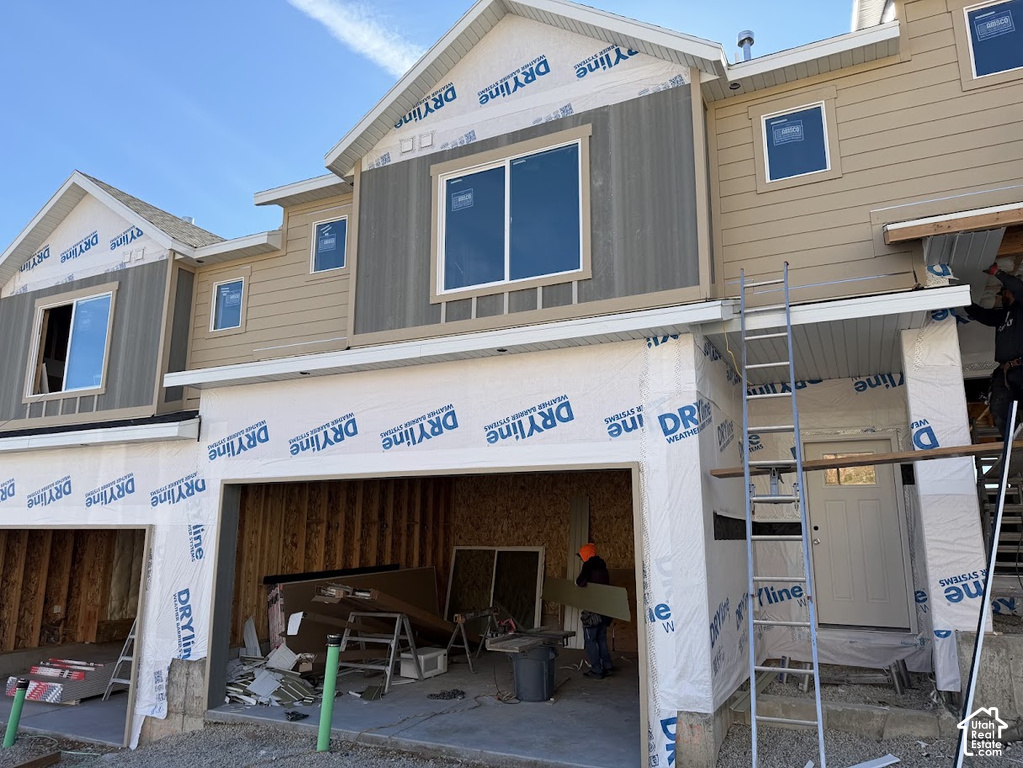
$560,500
1107 W VISTA RIDGE N DR
3 bd · 3 ba · 2,359 sqft
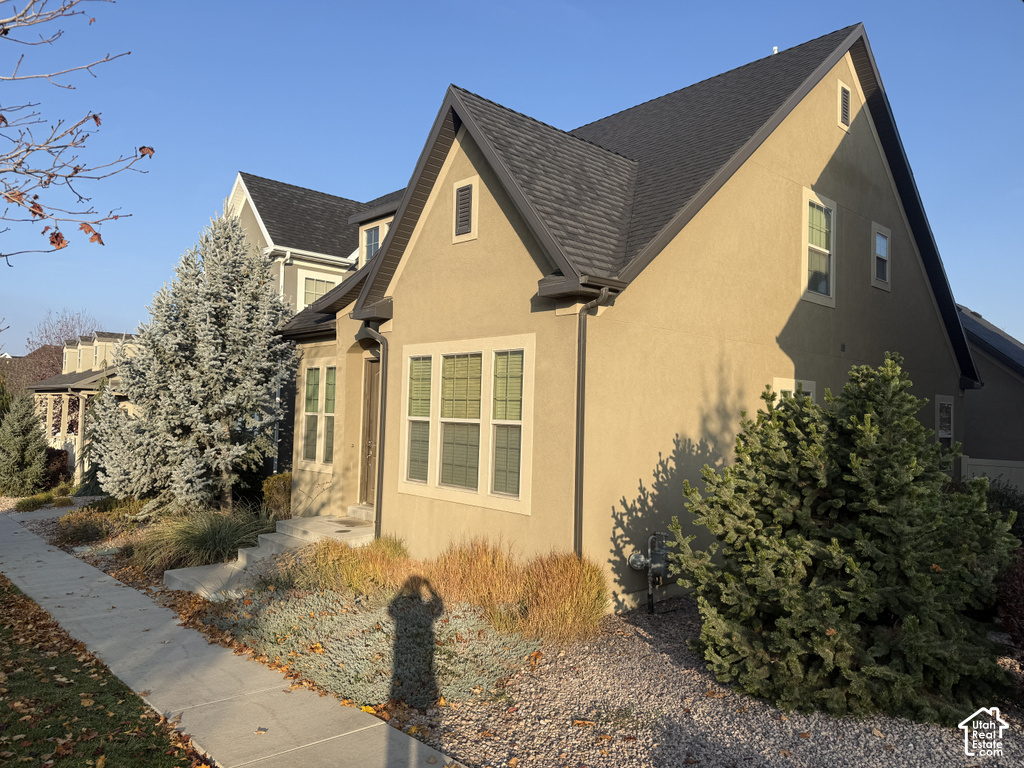
$599,000
813 W 2700 N
4 bd · 4 ba · 2,766 sqft
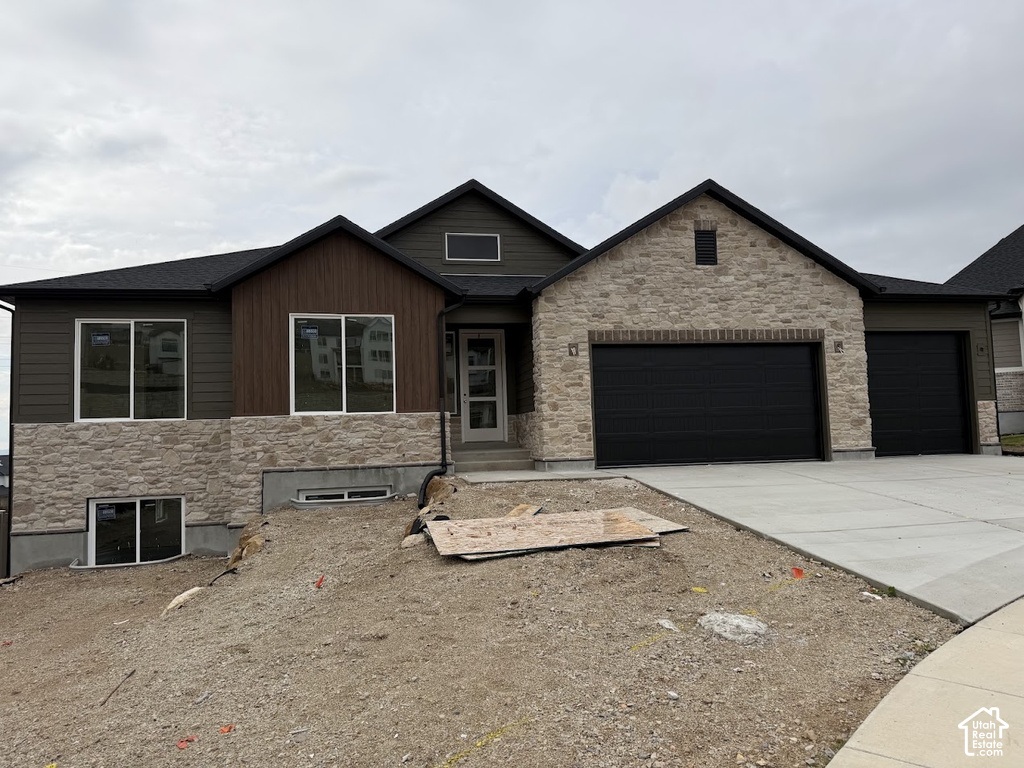
$1.14M
5351 N LOOKOUT W CV
3 bd · 3 ba · 4,814 sqft
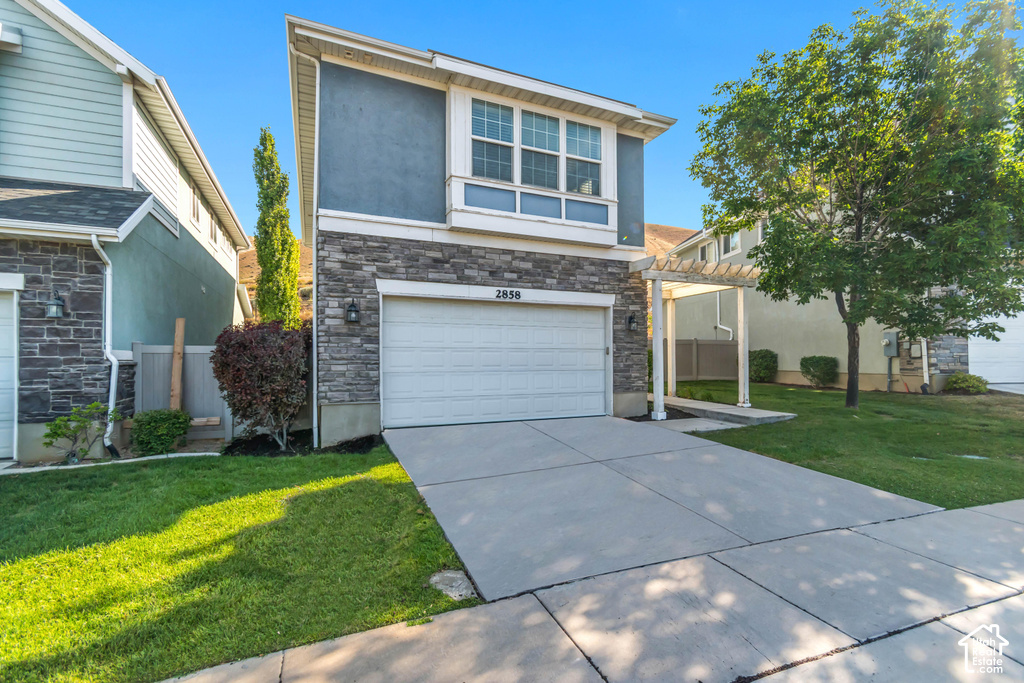
$569,900
2858 W BEAR RIDGE WAY
4 bd · 4 ba · 2,545 sqft
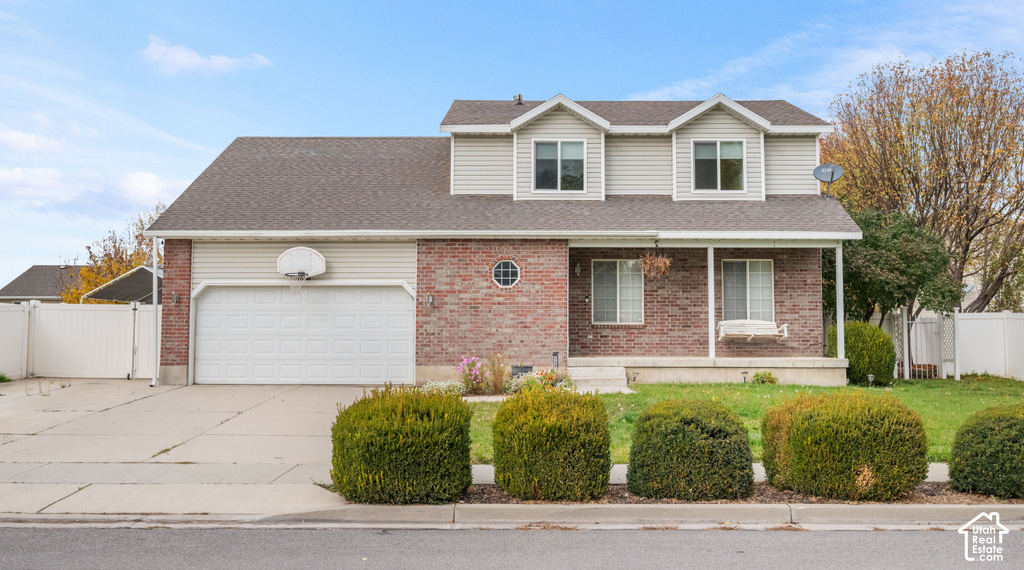
$559,900
1264 W 125 S
4 bd · 4 ba · 2,696 sqft
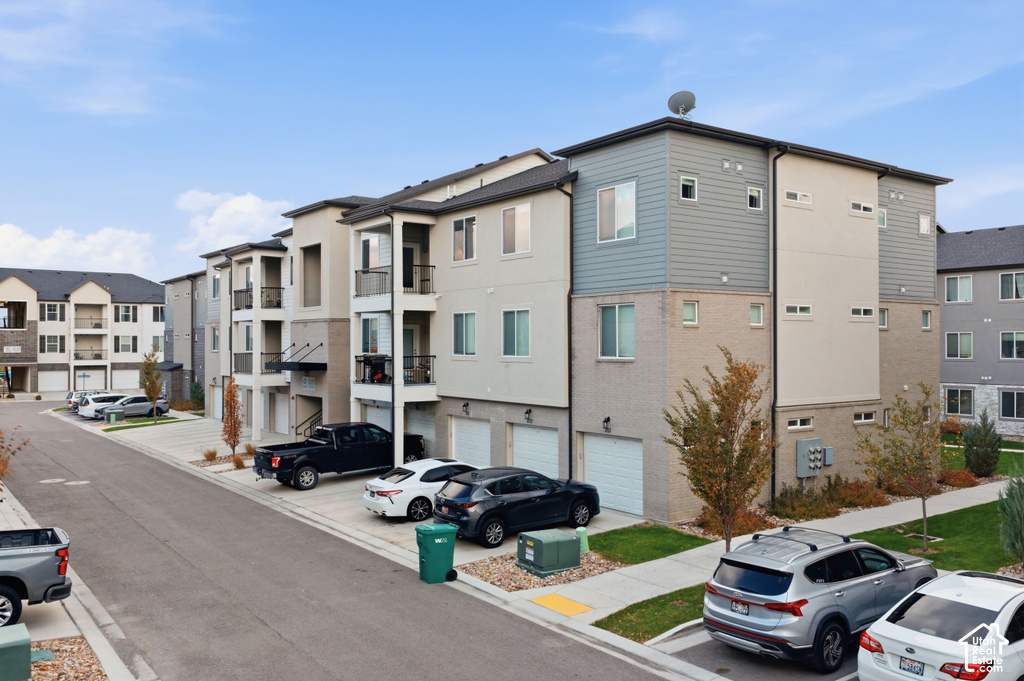
$329,900
3373 W 1960 N
3 bd · 2 ba · 1,233 sqft
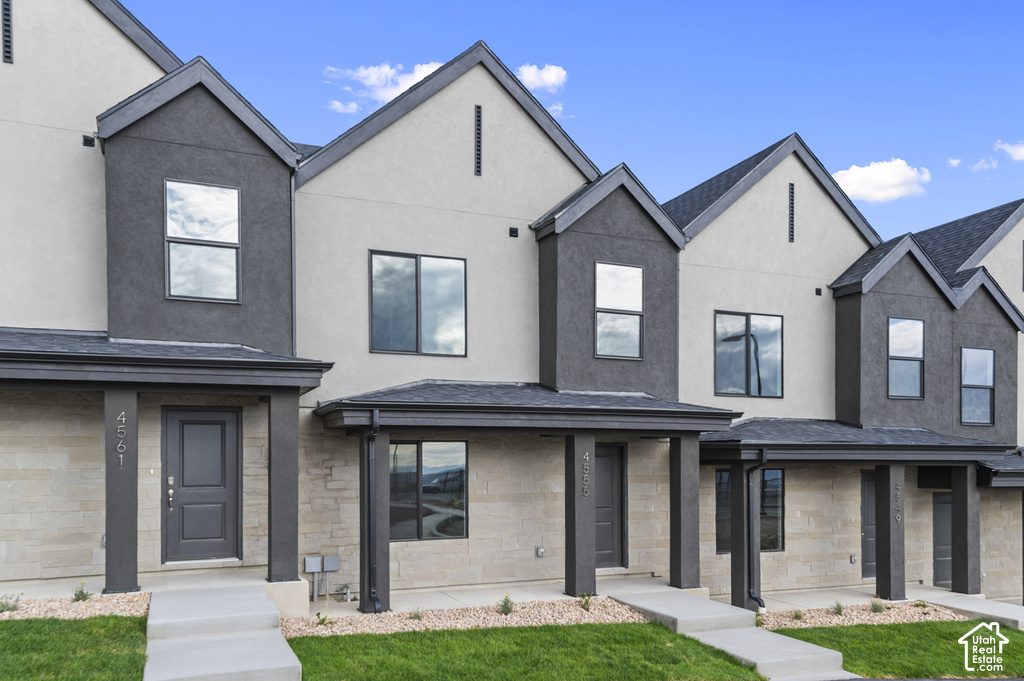
$359,990
4376 N GAIRLOCH LN
3 bd · 2 ba · 1,399 sqft
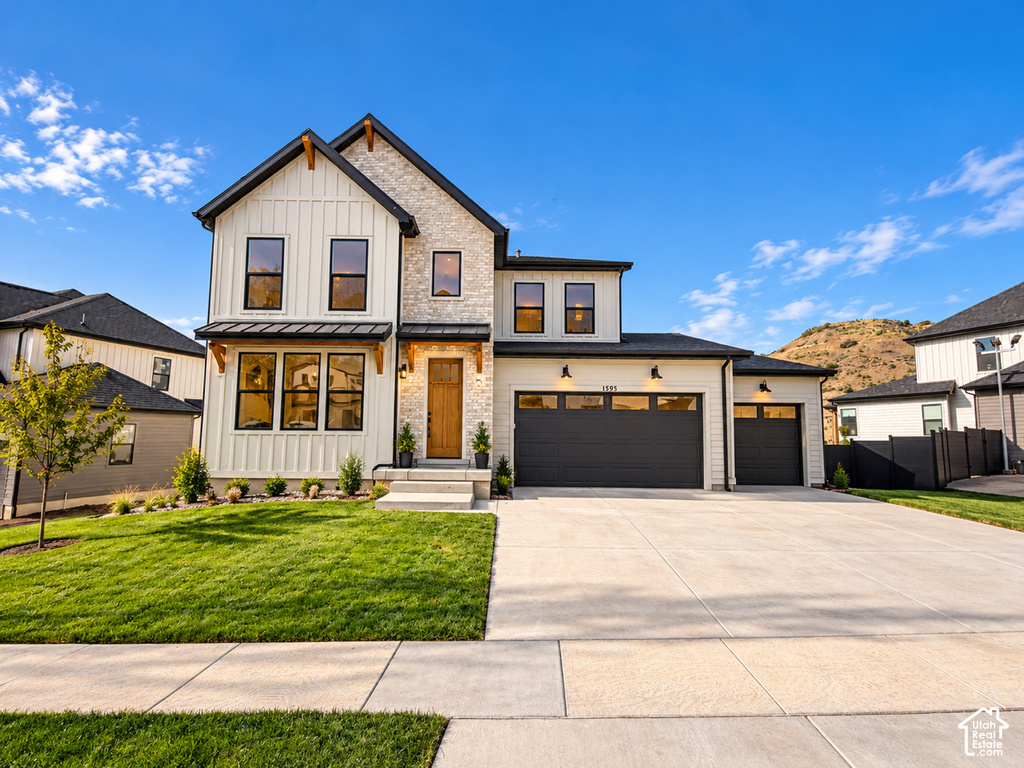
$1.30M
1595 W CANYON RIM RD
6 bd · 5 ba · 4,654 sqft
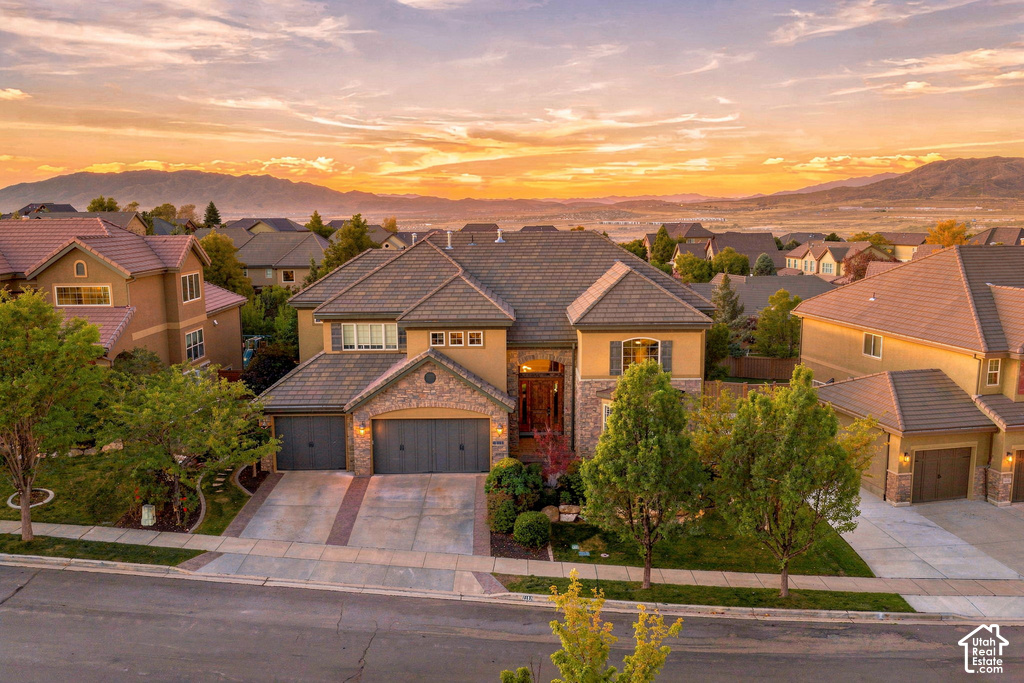
$1.20M
2183 W WHISPER WOOD N DR
8 bd · 7 ba · 6,928 sqft
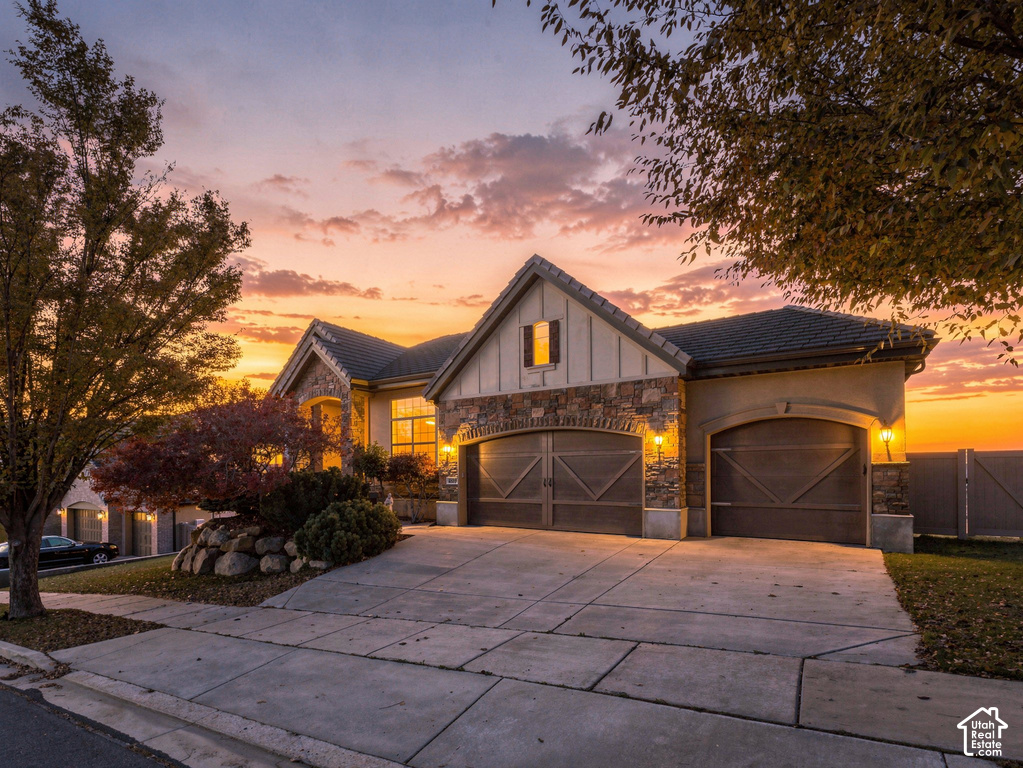
$897,000
4839 N WHISPER WOOD DR
5 bd · 3 ba · 4,002 sqft
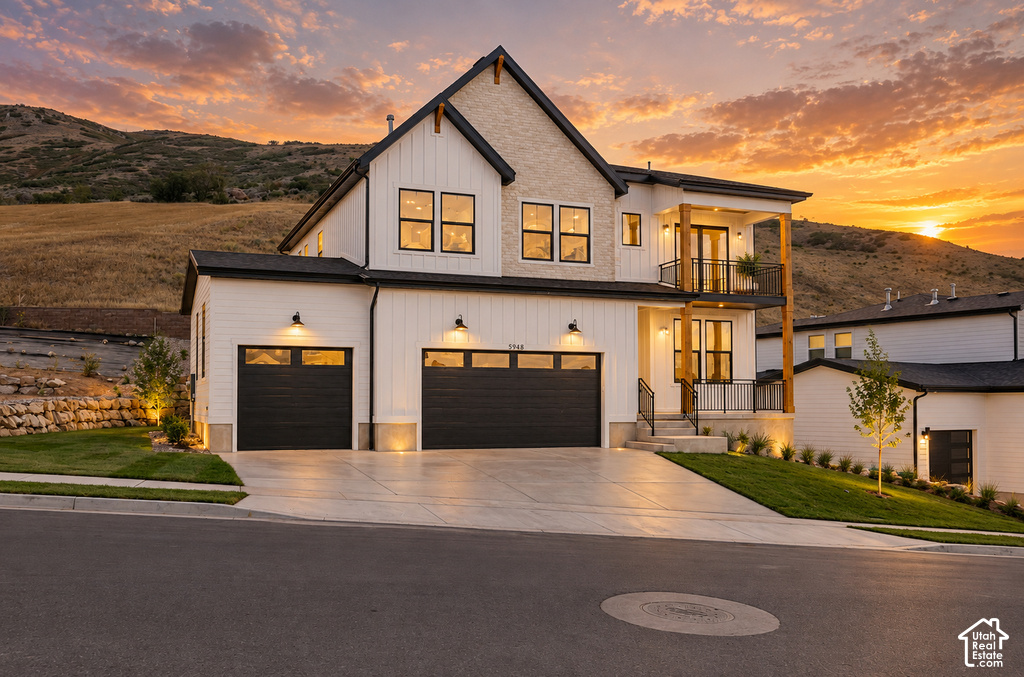
$989,000
5948 N CANYON RIM RD
4 bd · 4 ba · 3,507 sqft
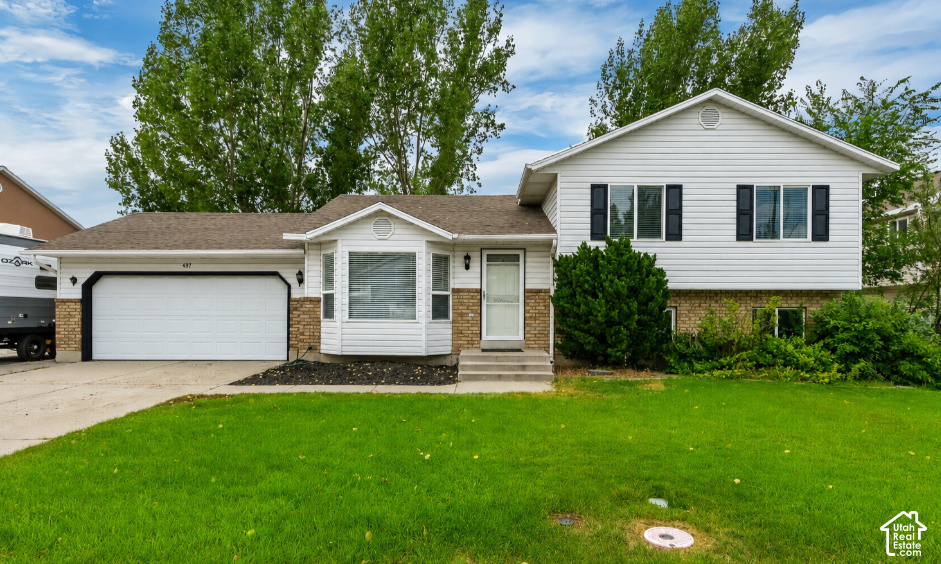
$549,900
497 W 2280 N
5 bd · 3 ba · 2,432 sqft
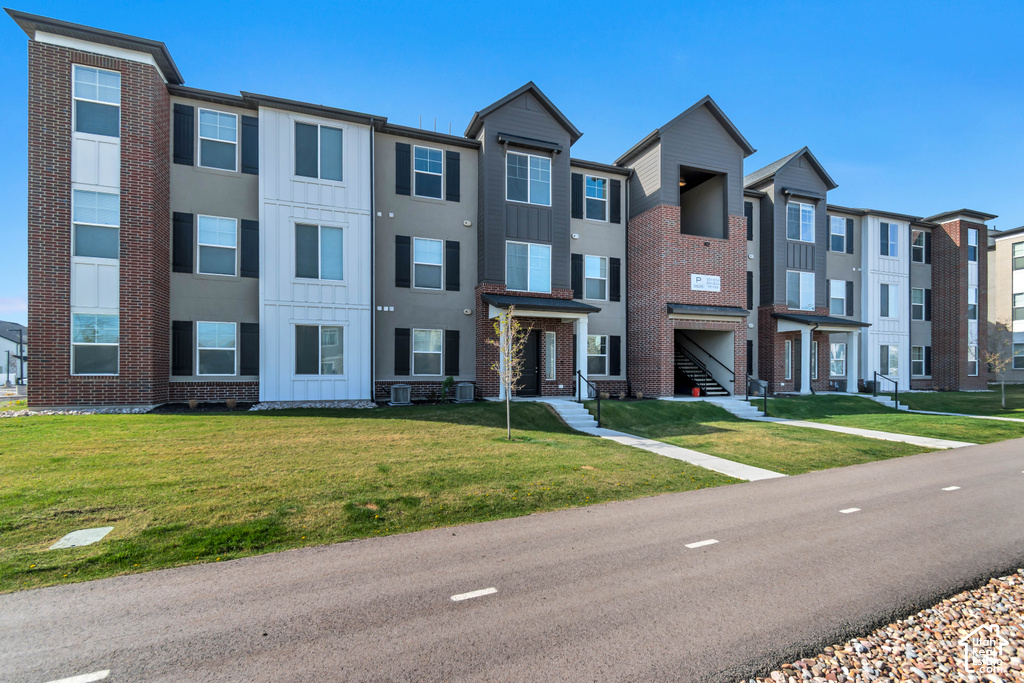
$349,800
3635 W 1500 N
3 bd · 2 ba · 1,349 sqft
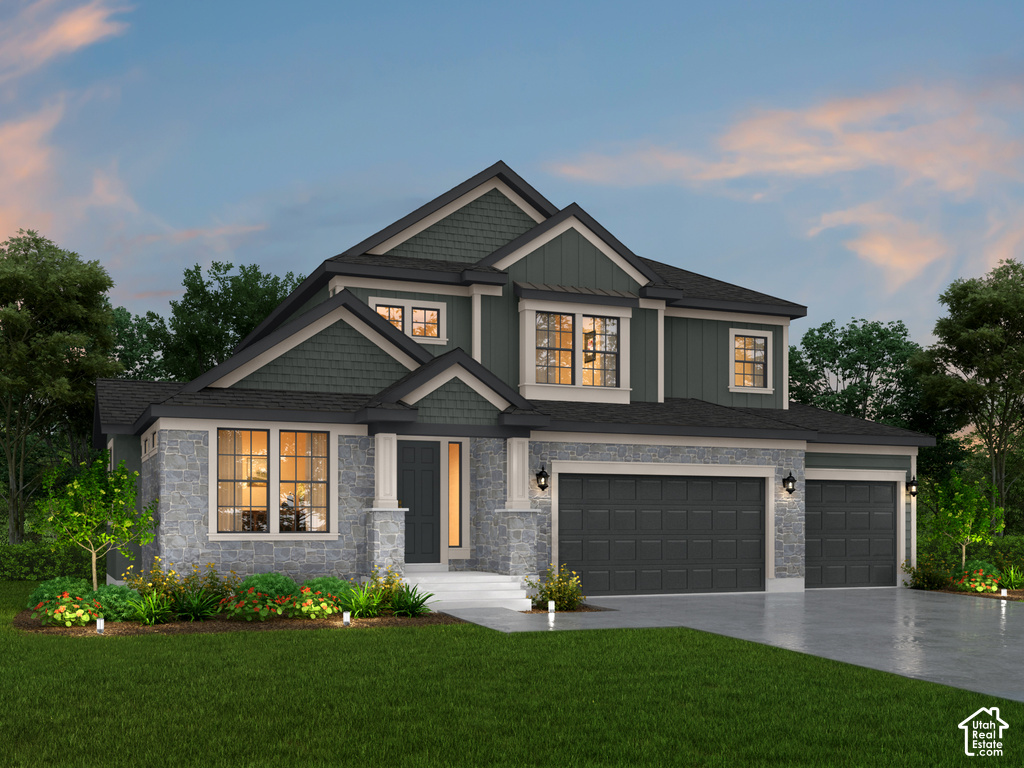
$1.07M
3077 N TWIN FLOWER WAY
4 bd · 3 ba · 4,355 sqft
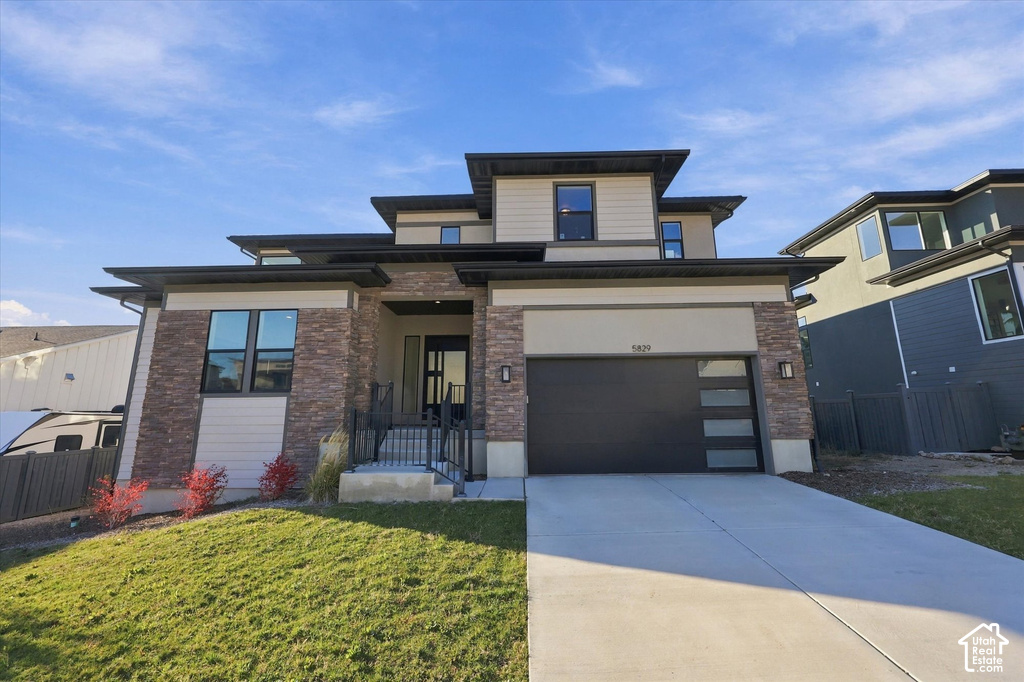
$1.25M
5829 N VALLEY VIEW N RD
7 bd · 5 ba · 4,424 sqft
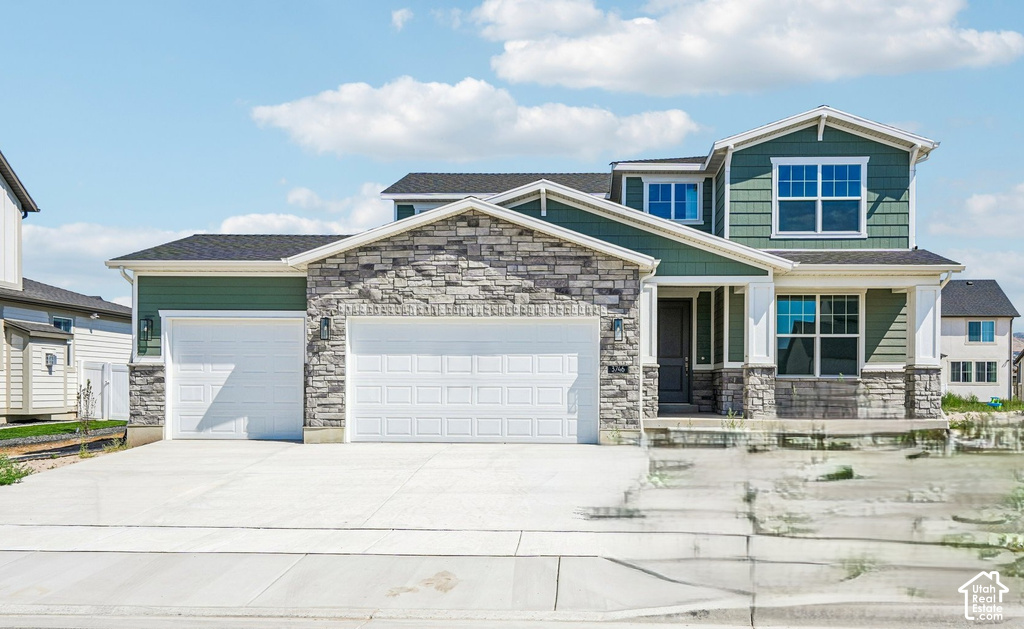
$798,700
3746 W 2500 N
3 bd · 3 ba · 3,312 sqft
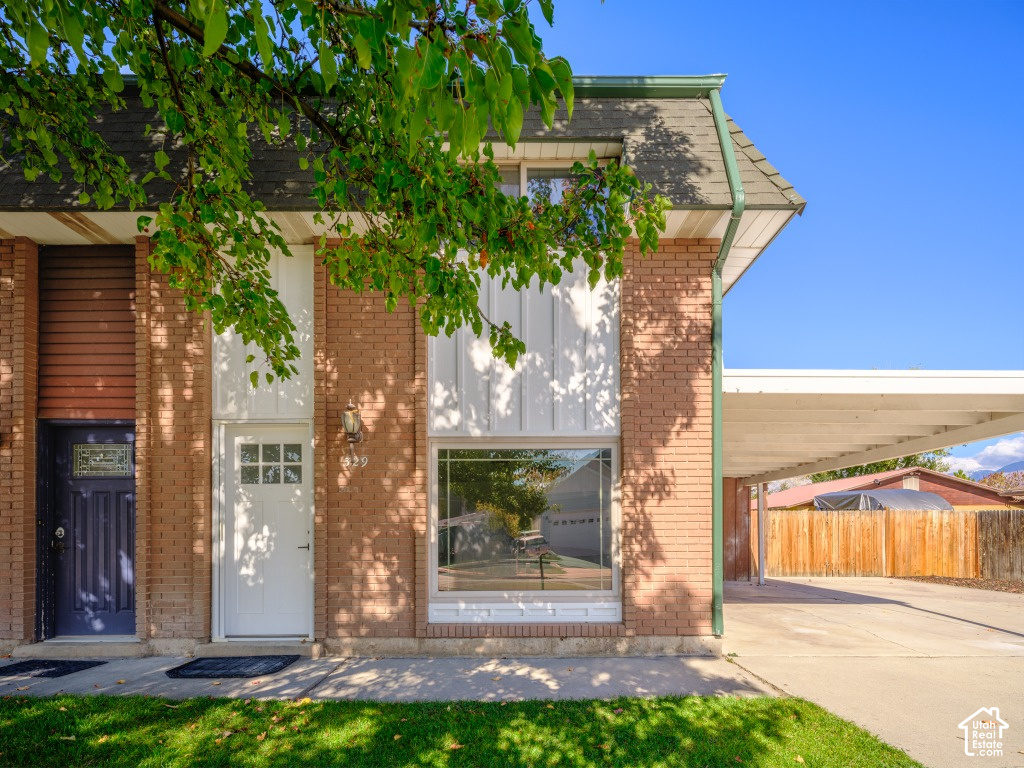
$489,000
329 E 300 S
3 bd · 2 ba · 1,470 sqft
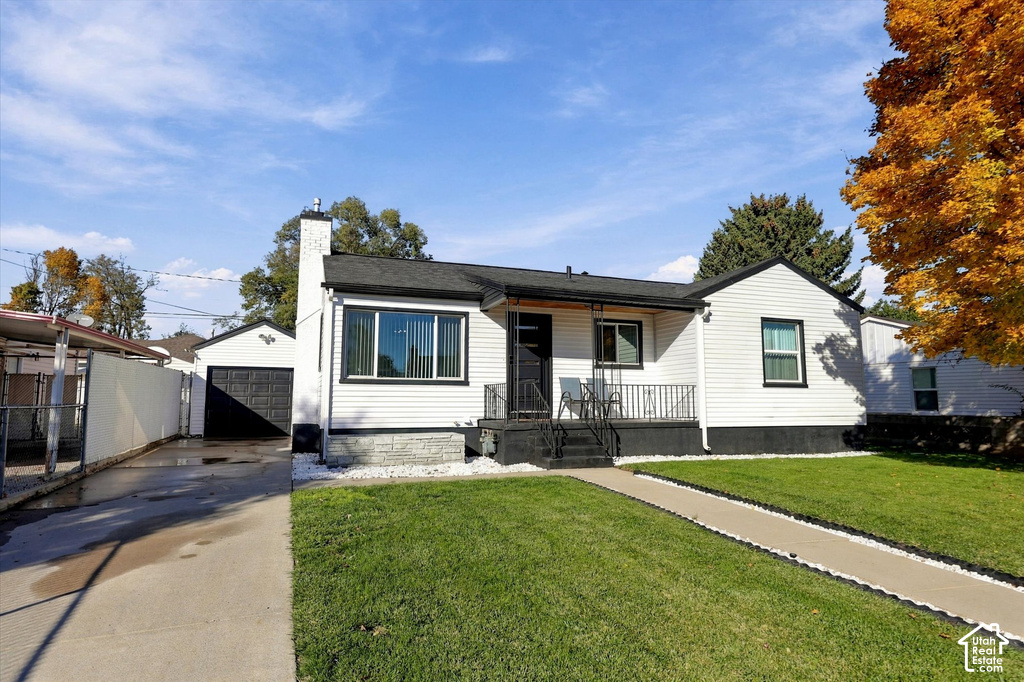
$533,000
278 W 500 N
3 bd · 2 ba · 1,750 sqft
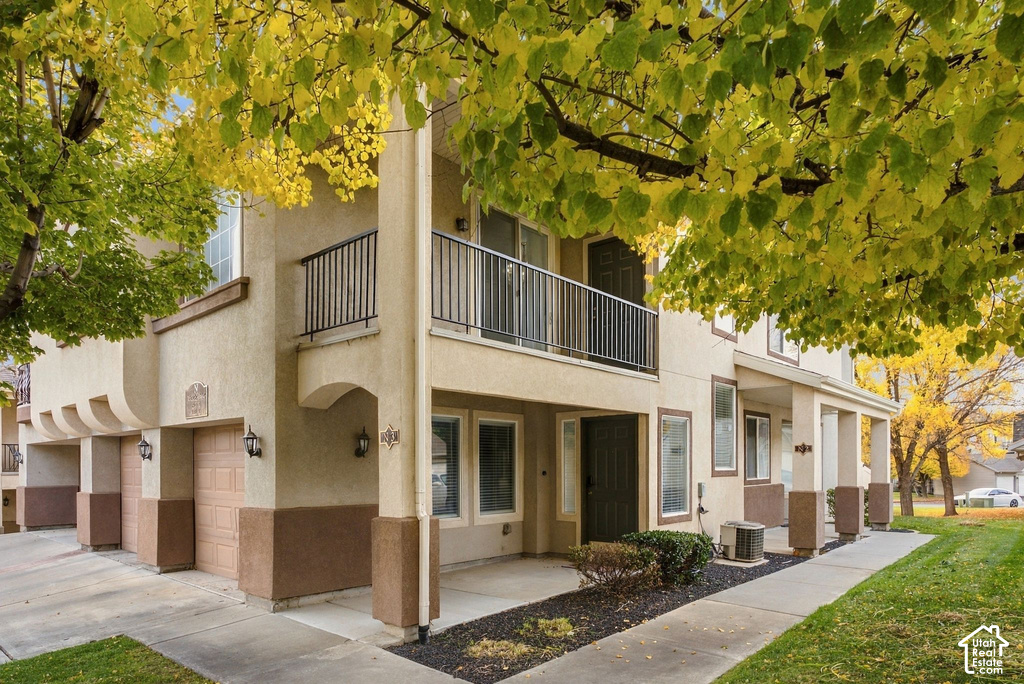
$334,900
2977 N 1410 W
2 bd · 2 ba · 1,484 sqft
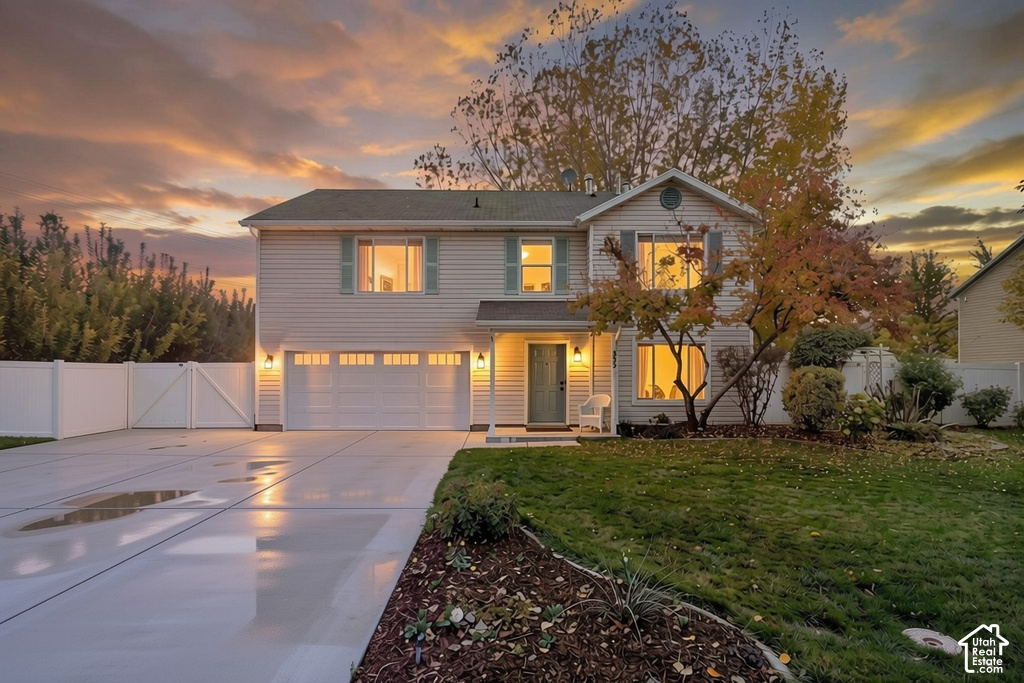
$575,000
835 S 1620 W
5 bd · 3 ba · 2,551 sqft
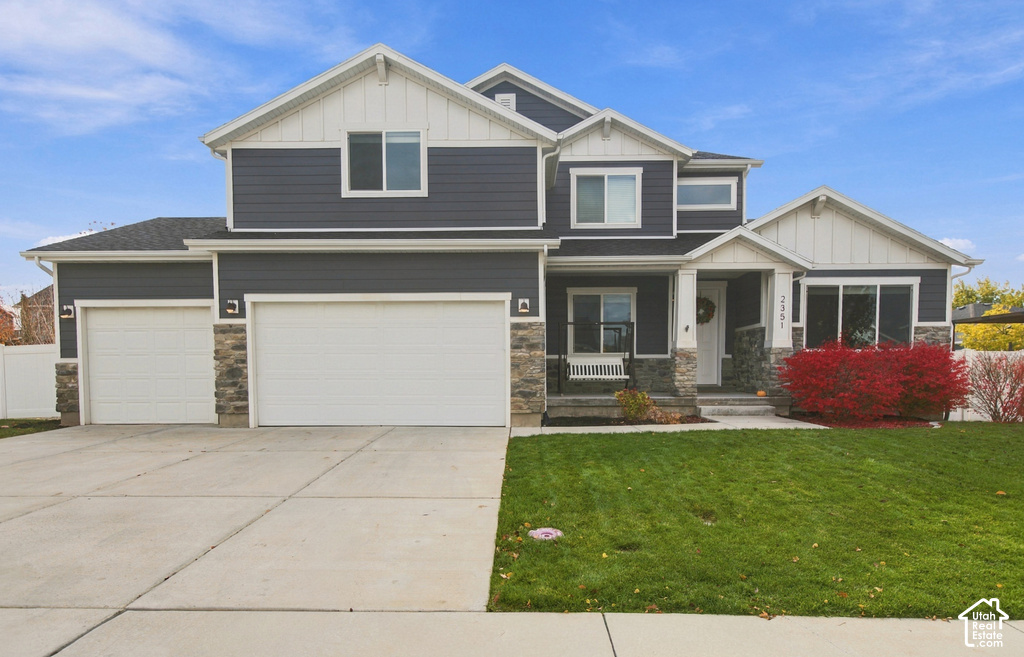
$784,900
2351 W DOWNY N DR
4 bd · 3 ba · 4,227 sqft
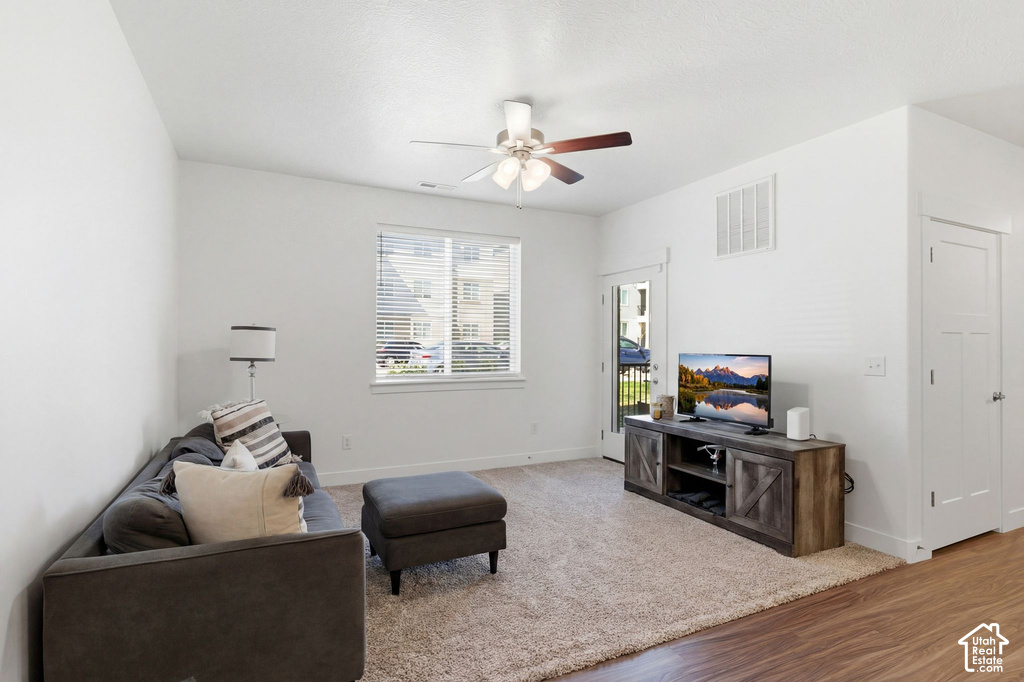
$355,000
1424 N 3830 W
3 bd · 2 ba · 1,223 sqft
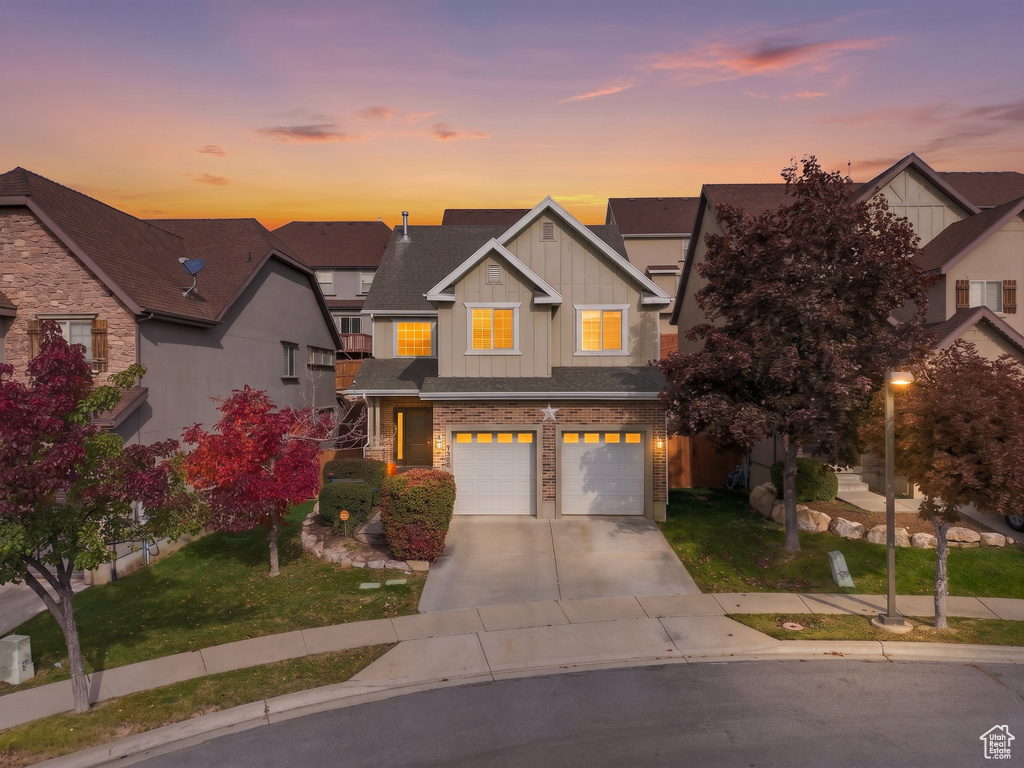
$580,000
2808 W PINE CONE LN
5 bd · 3 ba · 3,771 sqft
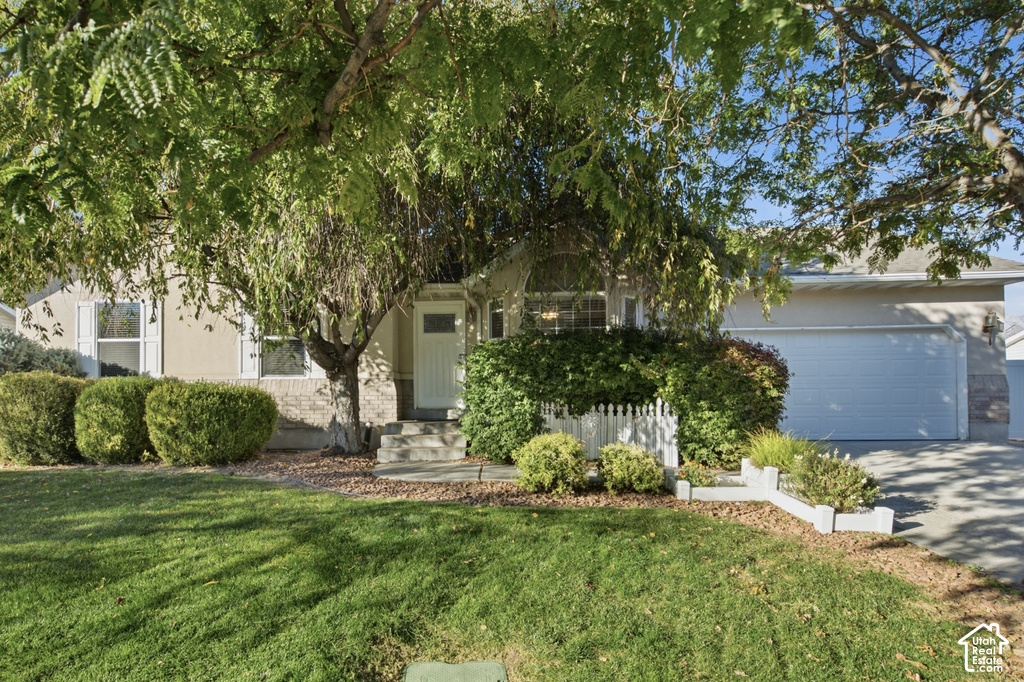
$569,900
951 E 2125 N
4 bd · 2 ba · 2,333 sqft
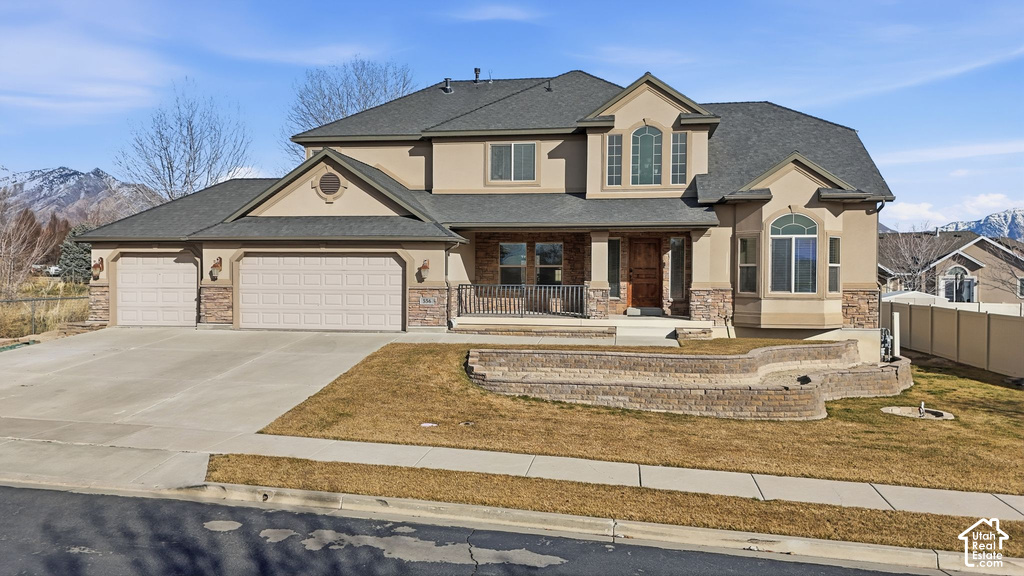
$1.20M
556 N 1440 E
6 bd · 4 ba · 6,000 sqft
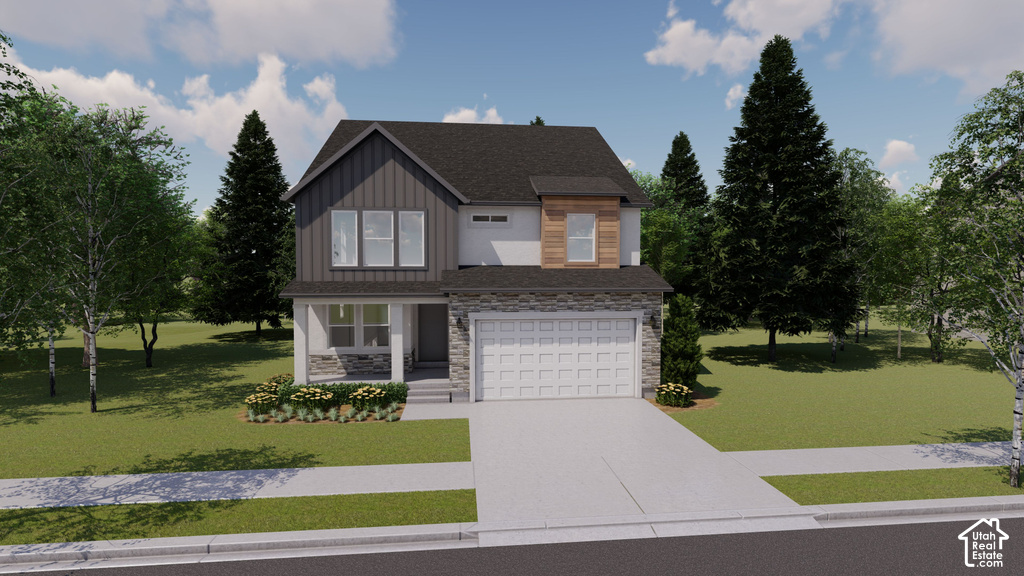
$698,900
3283 W 1050 N
3 bd · 3 ba · 3,623 sqft
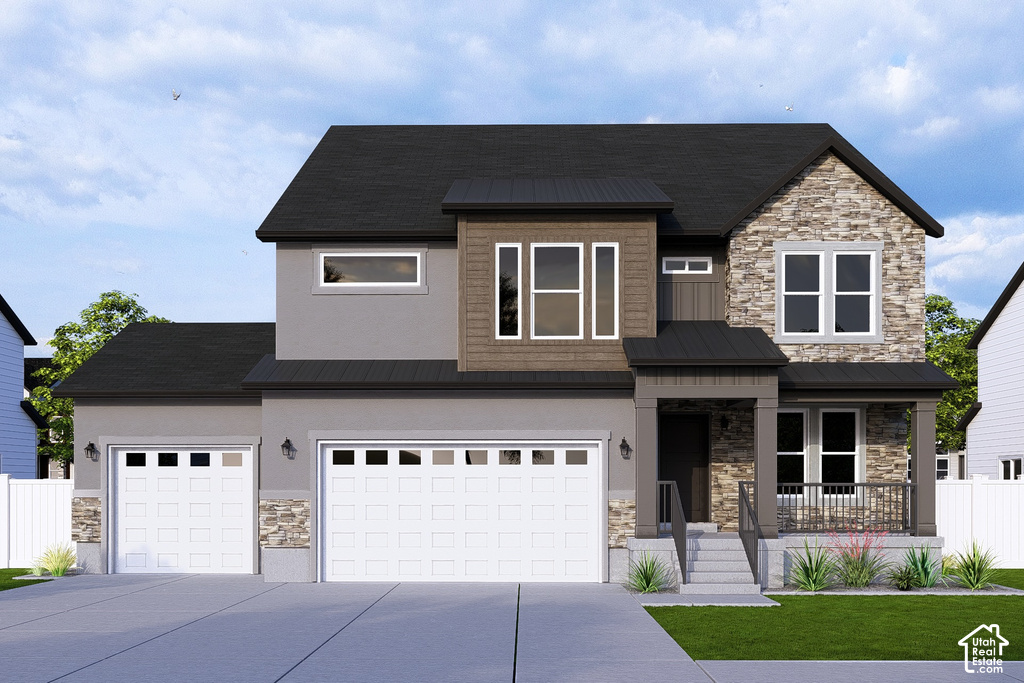
$744,900
3245 W 1050 N
3 bd · 3 ba · 3,810 sqft
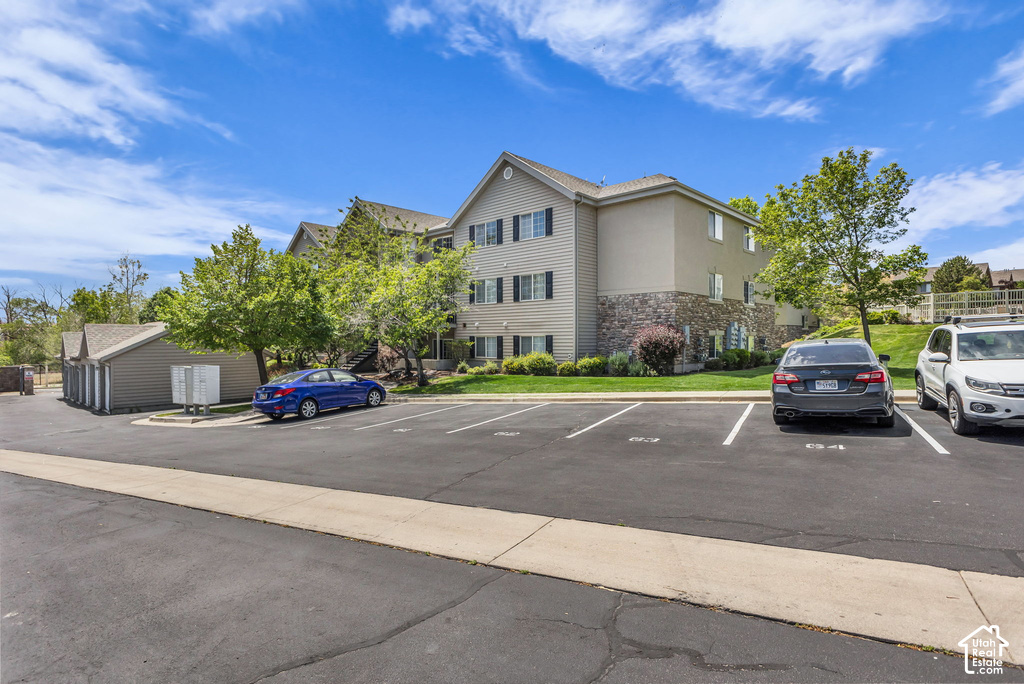
$297,000
1529 W WESTBURY WAY
3 bd · 2 ba · 1,255 sqft
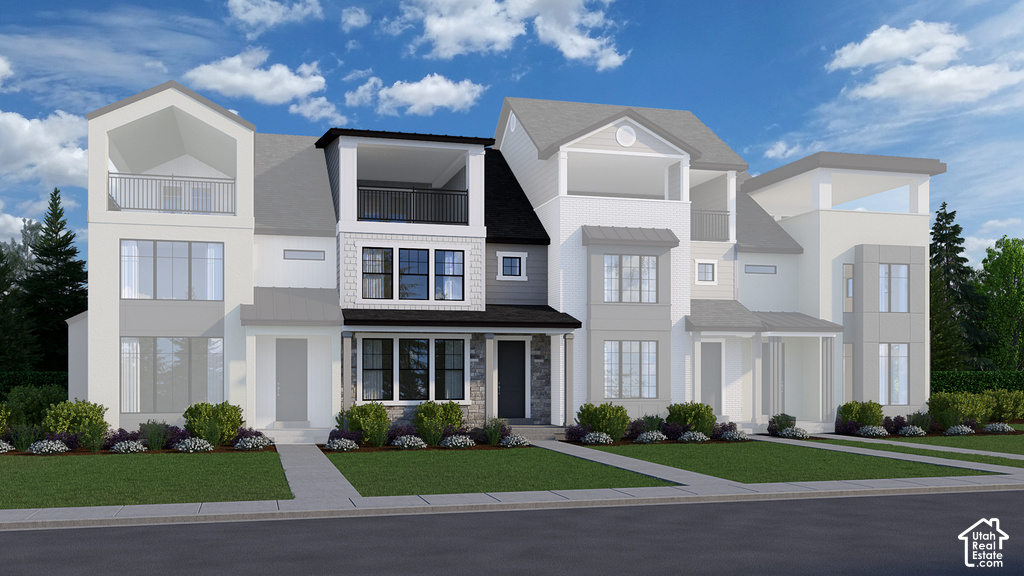
$584,900
5132 N VARIO ALY
3 bd · 3 ba · 2,594 sqft
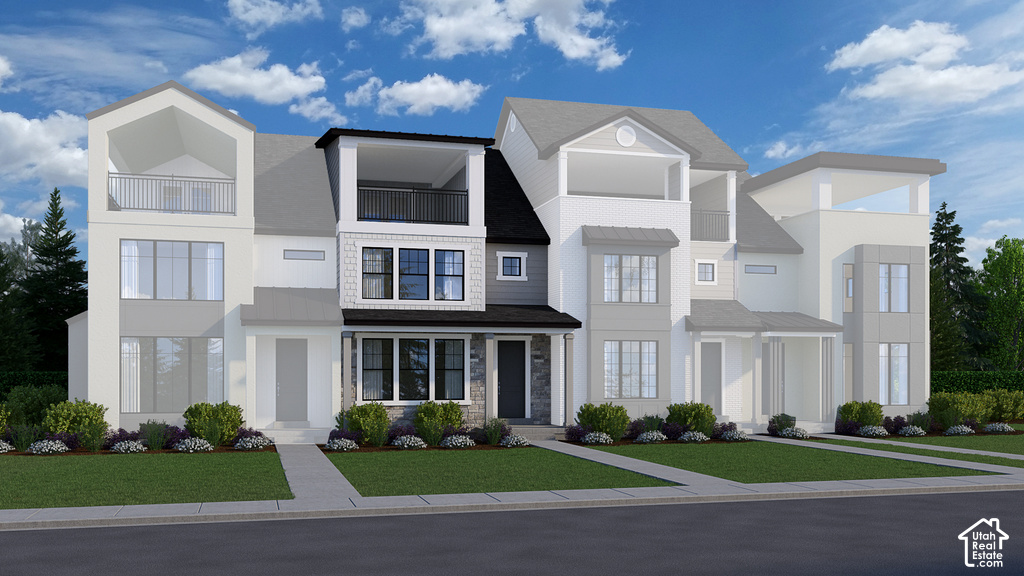
$584,900
5140 N VARIO ALY
3 bd · 3 ba · 2,594 sqft
Lehi investment property FAQs
- How many investment properties are listed in Lehi?
- There are 240 listings active or under contract in Lehi on UtahInvestor.com. This count covers the full local inventory, not just the properties displayed below.
- What is the median investment property price in Lehi?
- The median asking price is $632,400 for current listings in Lehi. Half of the asking prices fall at or below the median and half at or above it. This is a listing-price measure, not a median closed-sale price.
- What is the average cap rate in Lehi?
- An average reported cap rate is not currently available for Lehi. Missing cap-rate data does not mean a property has a zero return. Compare income, vacancy and operating expenses using the property analysis guide or our investor tools.