Investment Properties in Salem, Utah
132 active or under-contract listings in Salem, Utah.
Asking prices for Salem investment property currently run from $299,000 to $2.70M. Every listing below includes a proforma and gross-yield analysis so you can underwrite it before you call.
Salem investment property market
Salem, Utah has 132 investment listings currently active or under contract on UtahInvestor.com. The median asking price is $590,945. An average reported cap rate is not currently available.
Figures reflect current listing records, not closed sales or the entire rental market. Cap rates depend on reported income and expenses; verify each property’s financials before investing. Listings under contract may not be available for purchase.
Current listings
132
Median price
$590,945
Avg reported cap rate
—
Avg units
1.0
Current listings
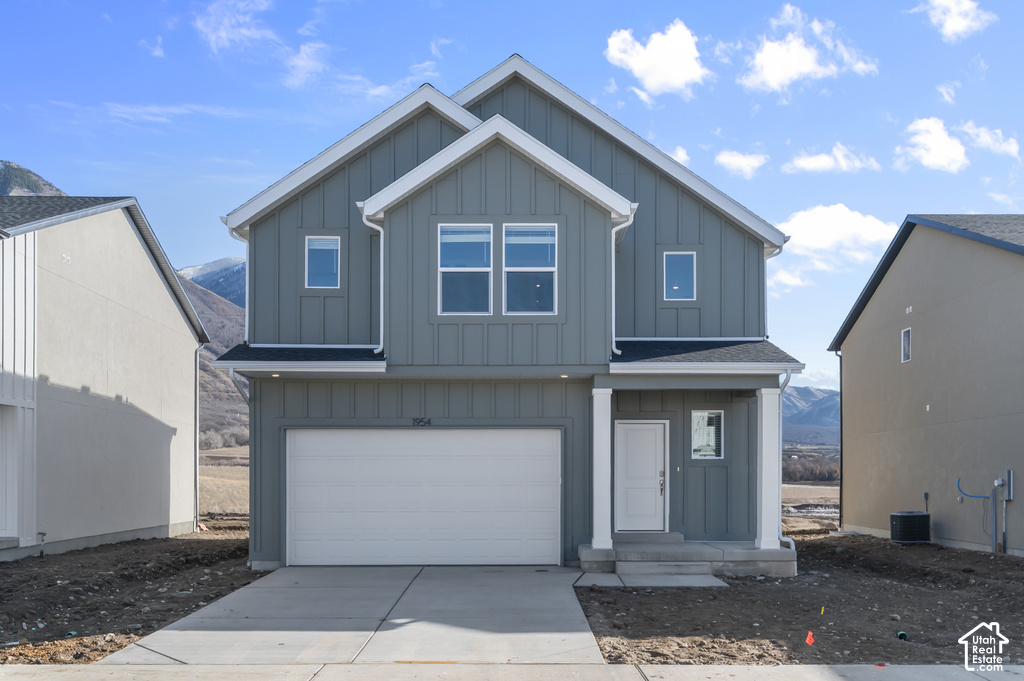
$522,990
1966 E BELMONT LN
3 bd · 3 ba · 3,227 sqft
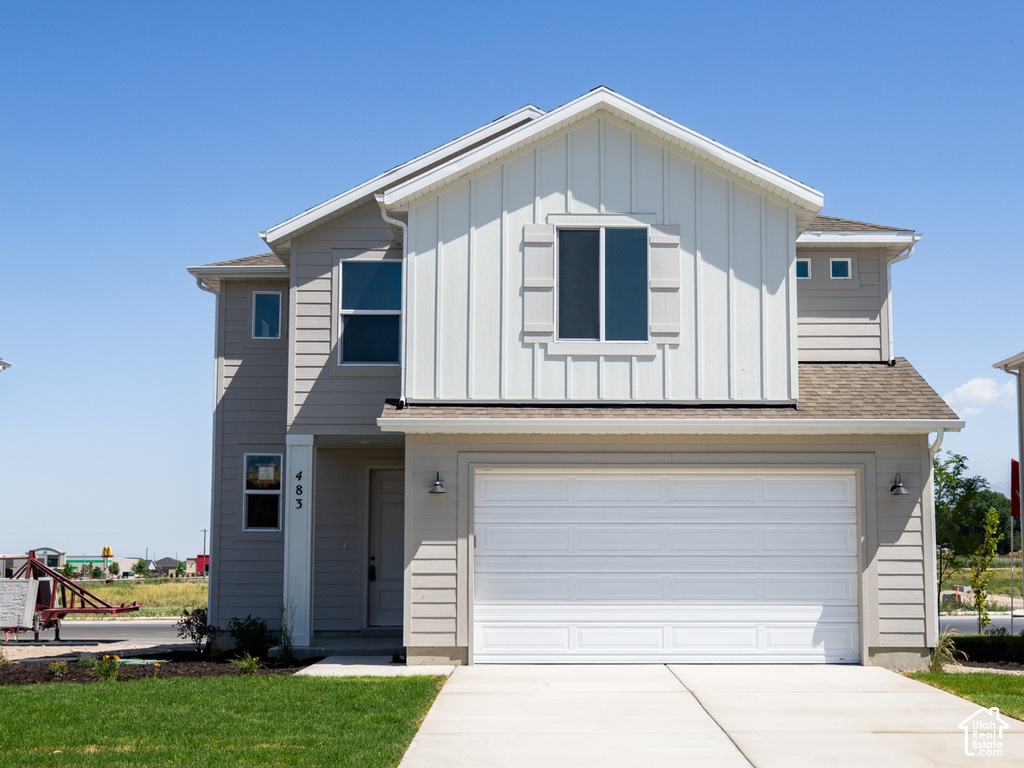
$522,900
483 E 720 N LOT #6 N
4 bd · 3 ba · 2,101 sqft
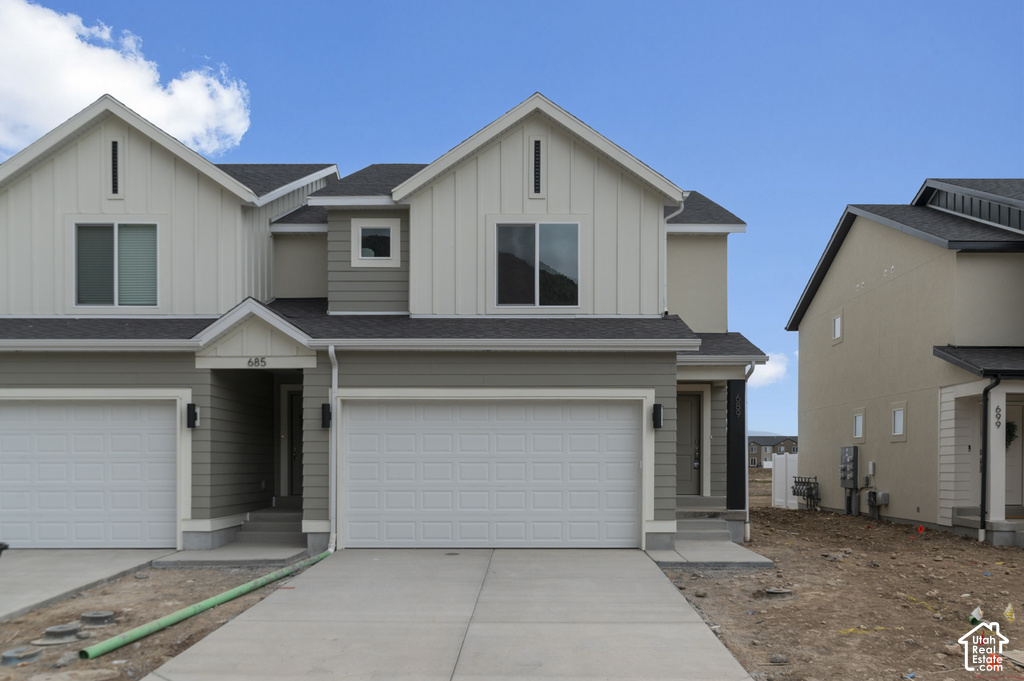
$419,990
1975 E BELMONT LN
3 bd · 3 ba · 2,205 sqft
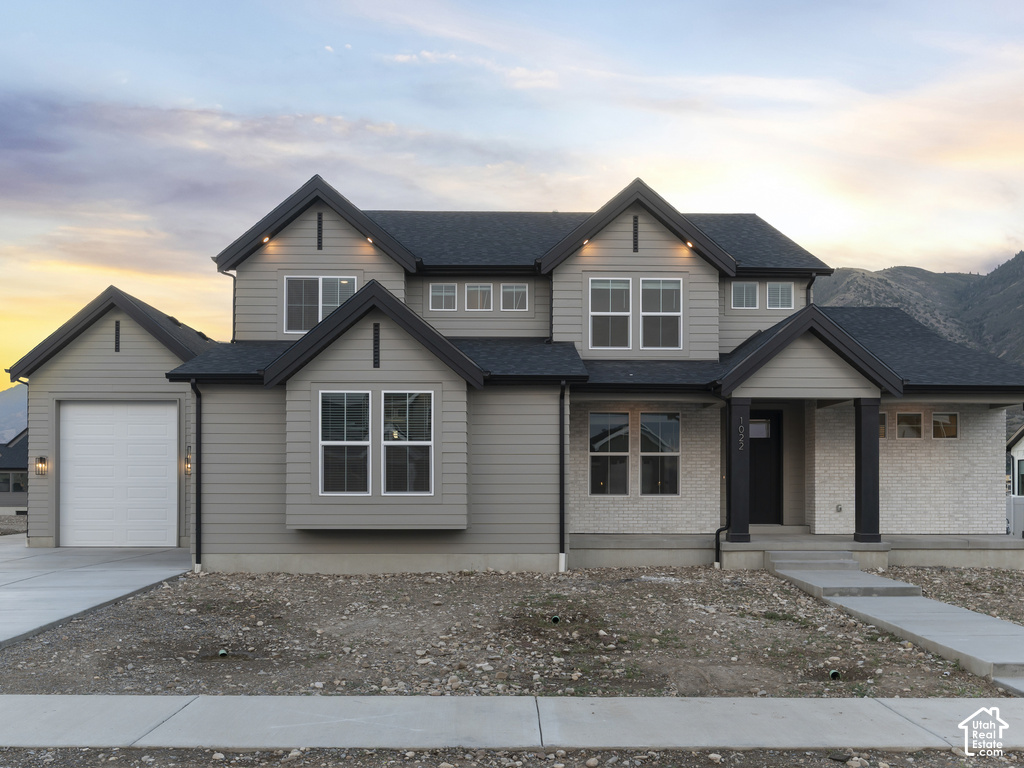
$899,990
1024 N 1750 E
4 bd · 3 ba · 4,617 sqft
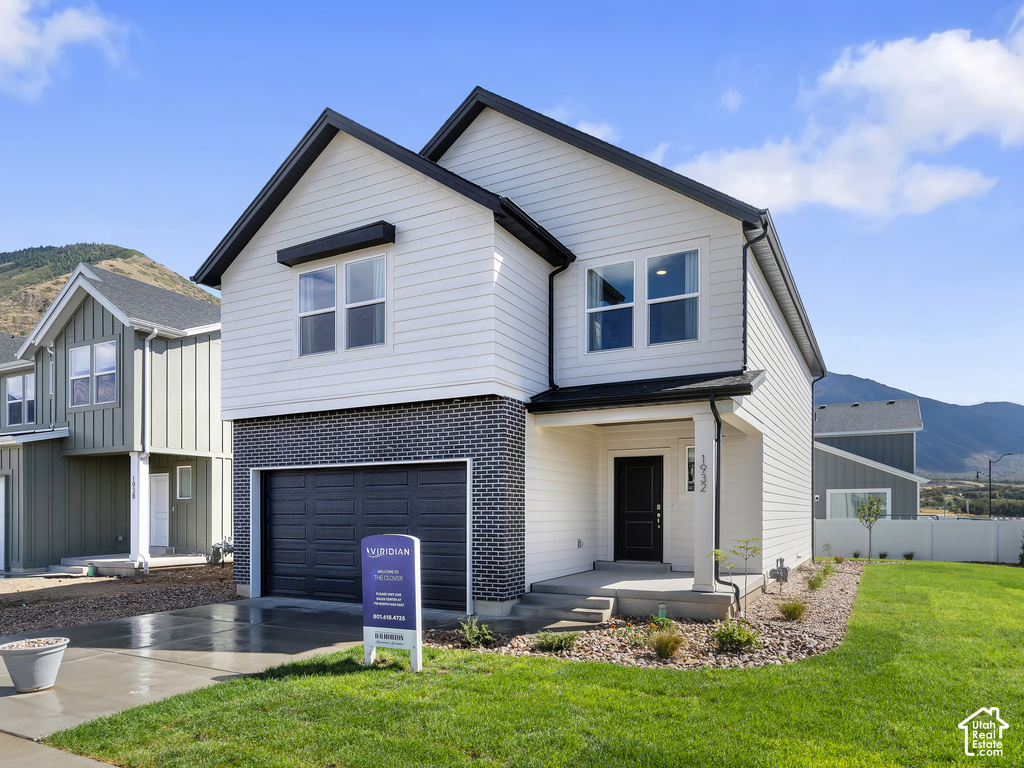
$499,990
2026 E BELMONT LN
3 bd · 3 ba · 3,011 sqft
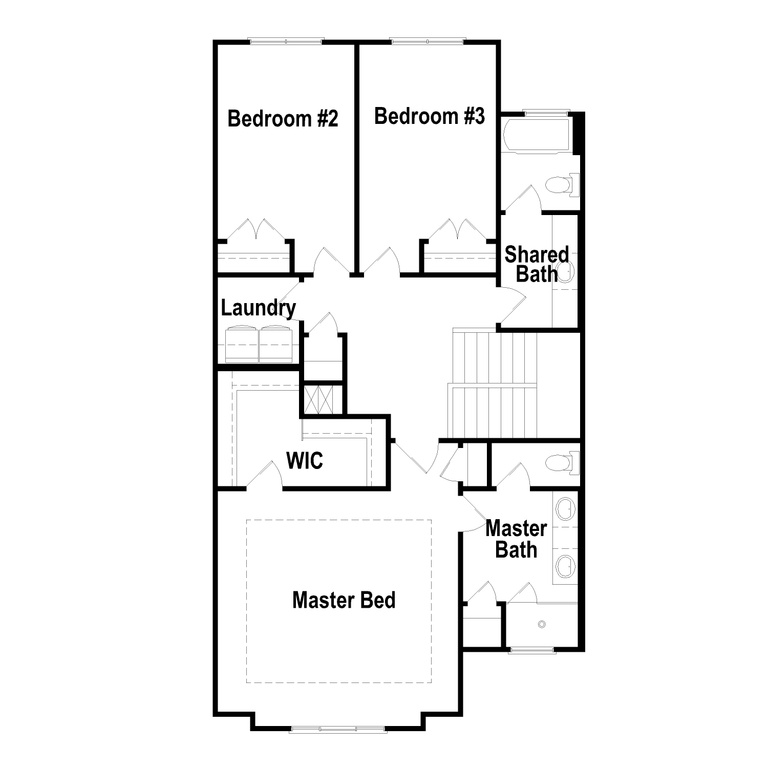
$439,900
1529 N 305 E
3 bd · 3 ba · 2,509 sqft
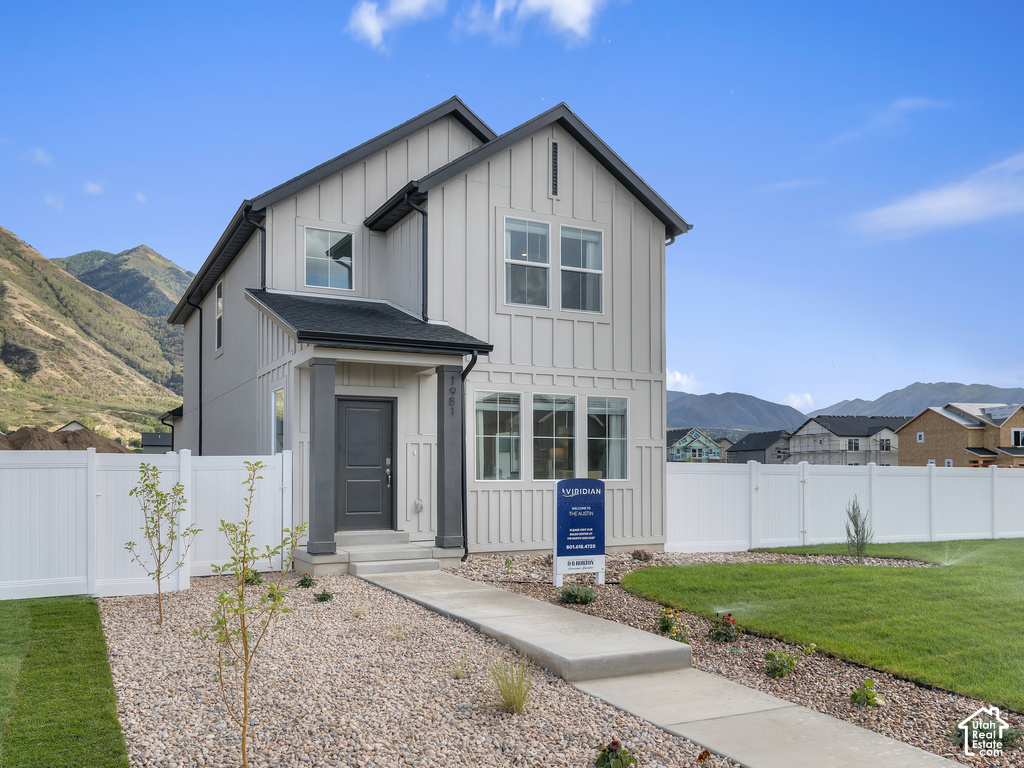
$489,990
2035 E CORRIENTE DR
3 bd · 3 ba · 2,445 sqft
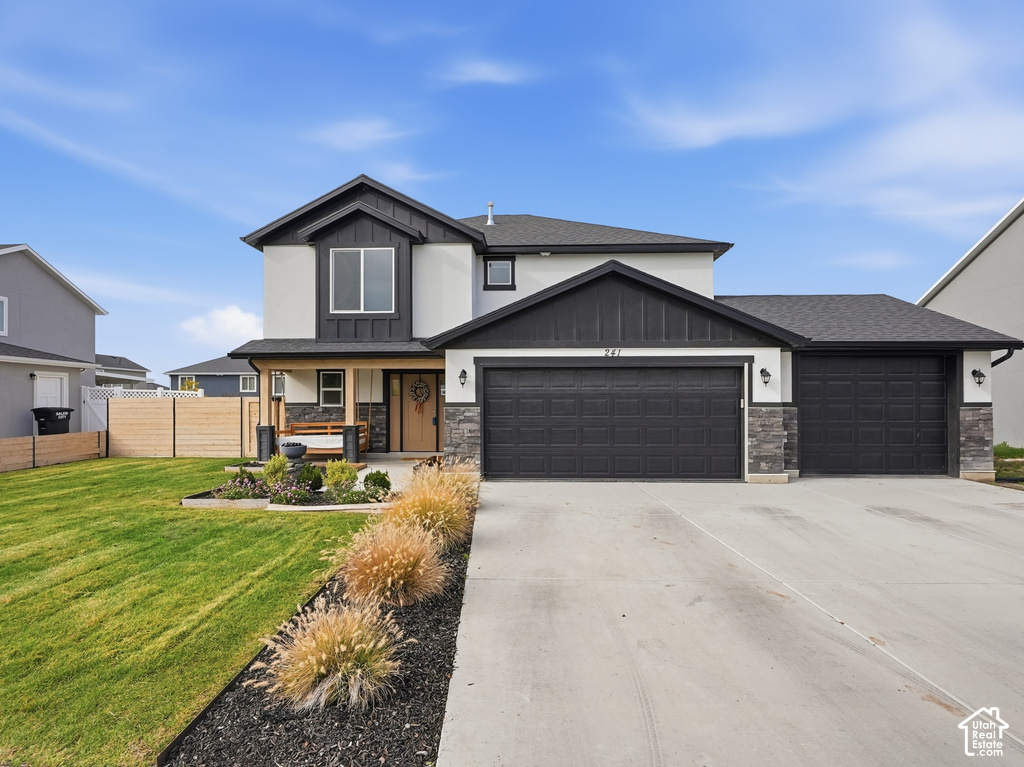
$549,900
241 N 300 E
4 bd · 3 ba · 2,064 sqft
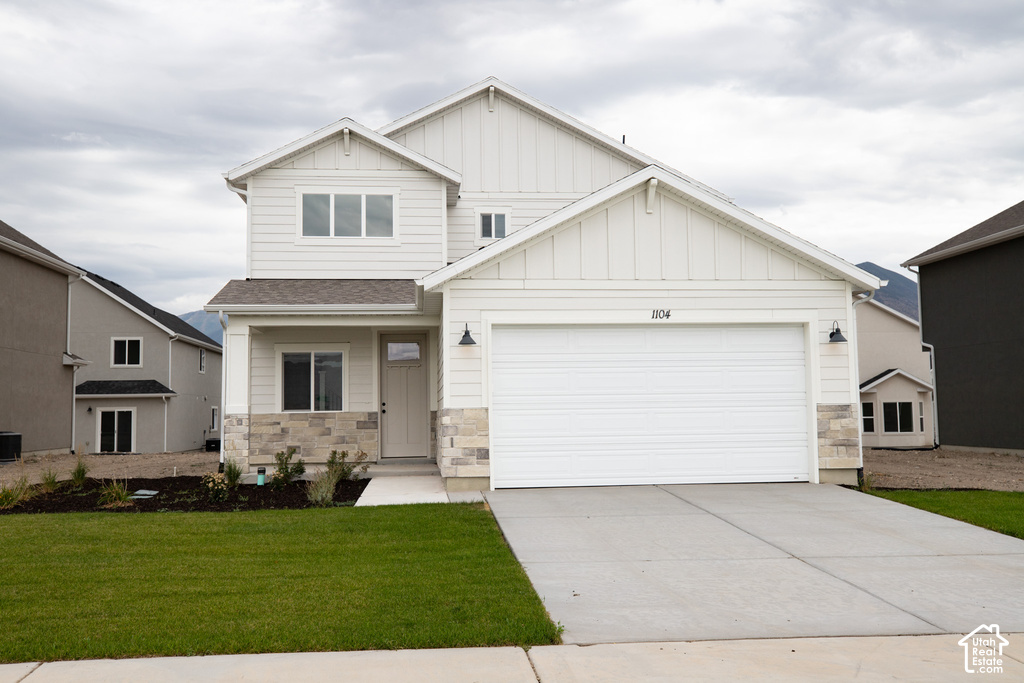
$462,900
1104 N 1110 W LOT #42
3 bd · 3 ba · 1,461 sqft
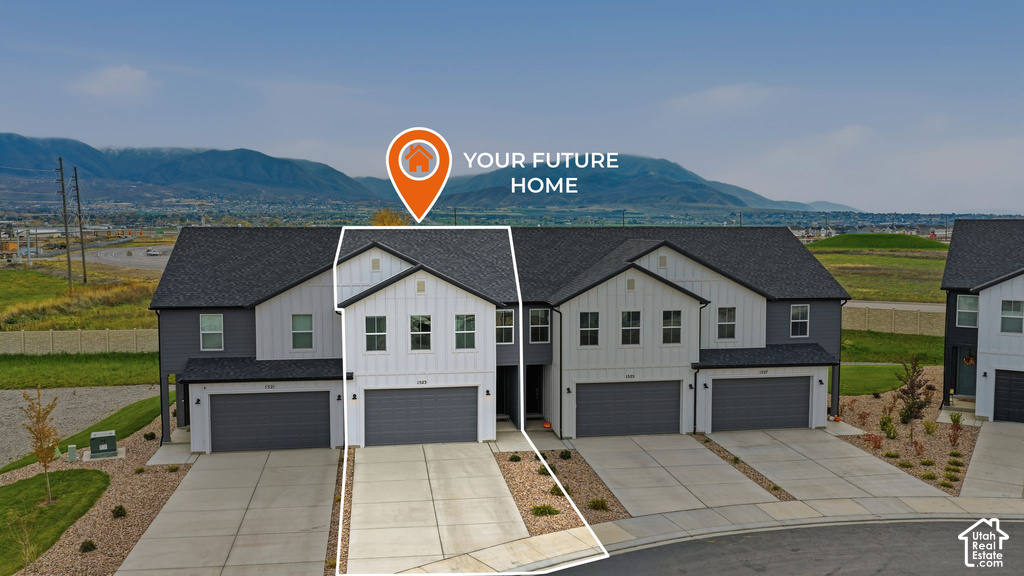
$374,900
1523 N SUMMER SPRINGS CV
3 bd · 3 ba · 1,764 sqft
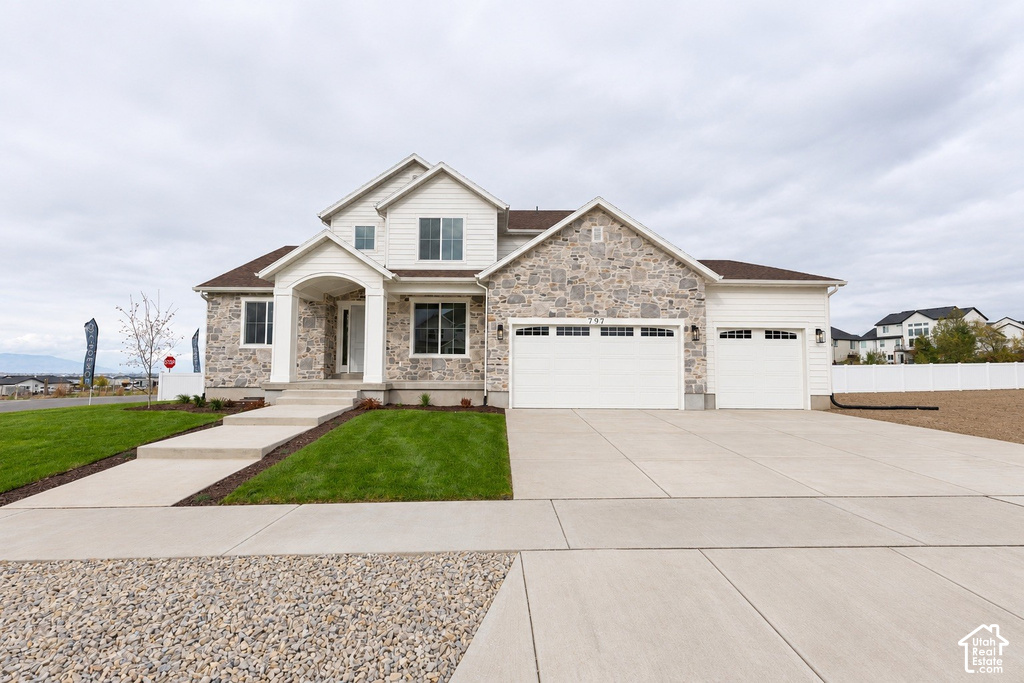
$915,900
797 E 370 N ST
4 bd · 3 ba · 4,865 sqft
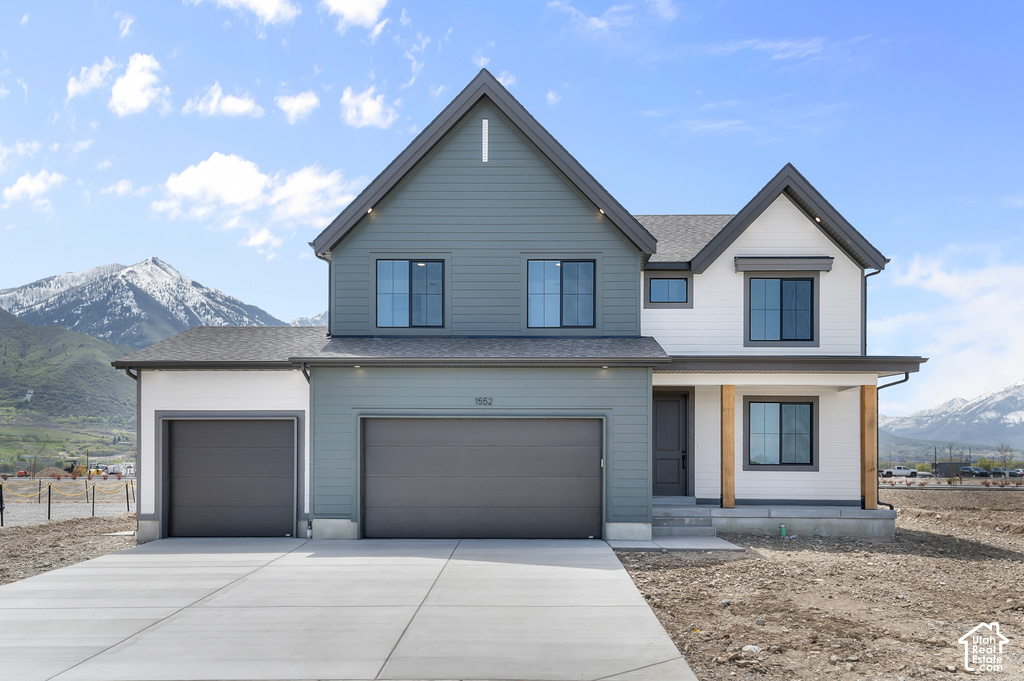
$679,990
1678 E 960 N
4 bd · 3 ba · 3,652 sqft
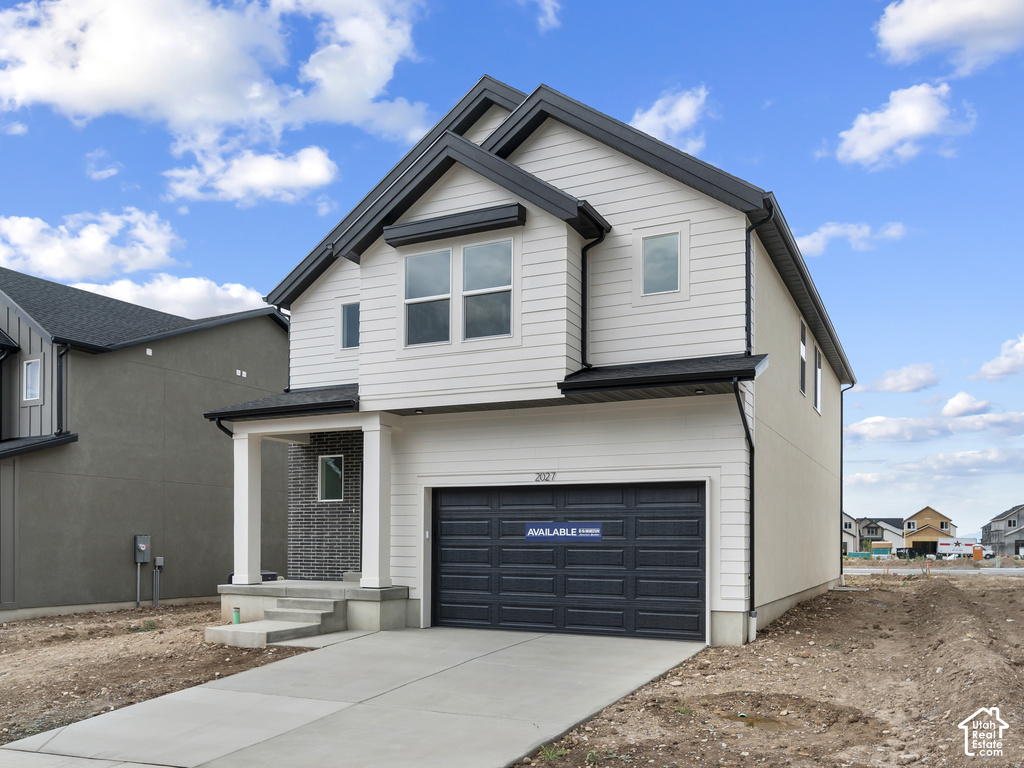
$529,990
2008 E BELMONT LN
3 bd · 3 ba · 3,227 sqft
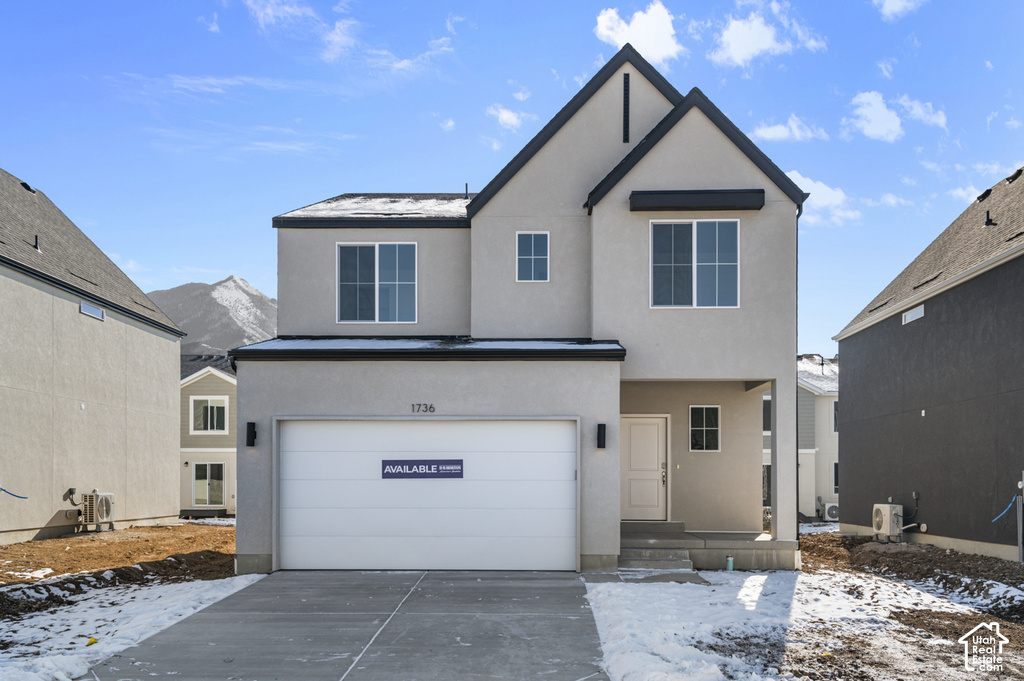
$525,990
2016 E BELMONT LN
4 bd · 3 ba · 2,888 sqft
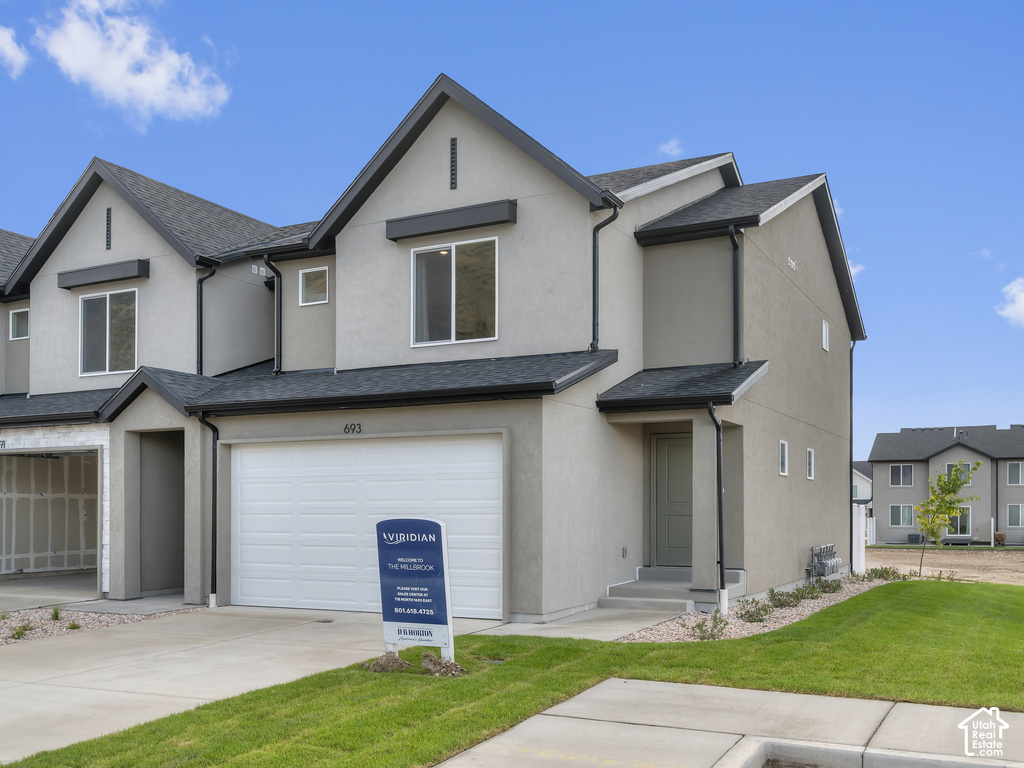
$419,990
1993 E BELMONT LN
3 bd · 3 ba · 2,205 sqft
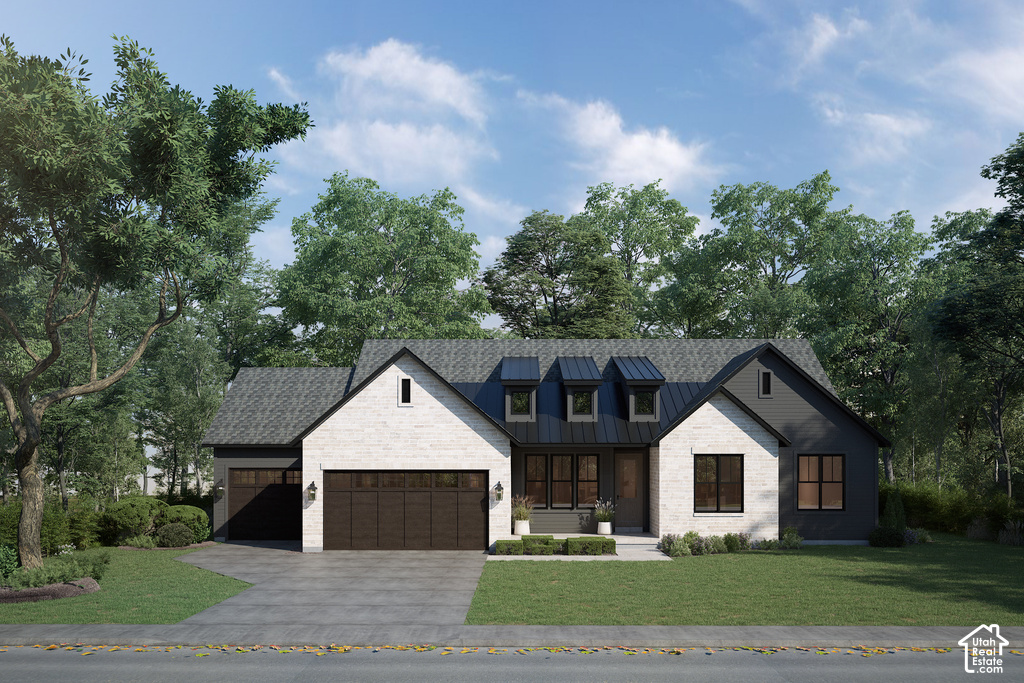
$1.11M
1571 S 920 E
3 bd · 3 ba · 3,969 sqft
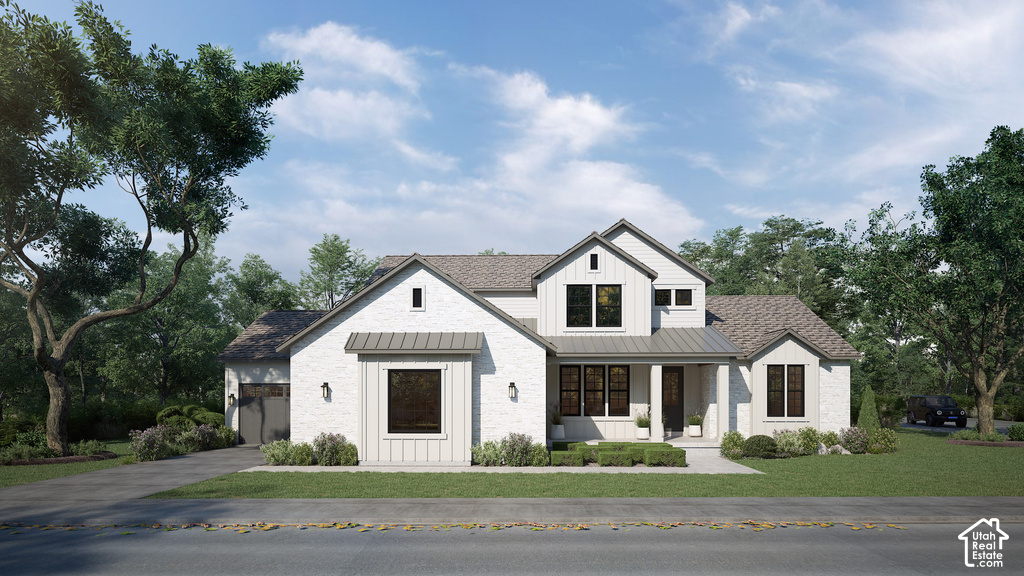
$1.30M
1549 S 920 E
6 bd · 4 ba · 4,887 sqft
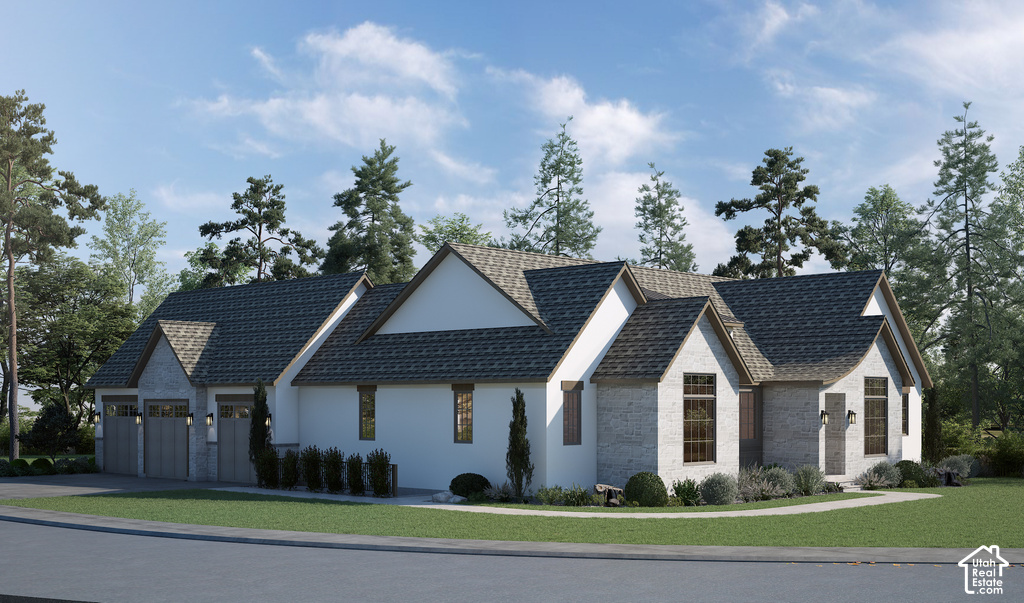
$1.49M
768 E 1610 S
6 bd · 6 ba · 4,845 sqft
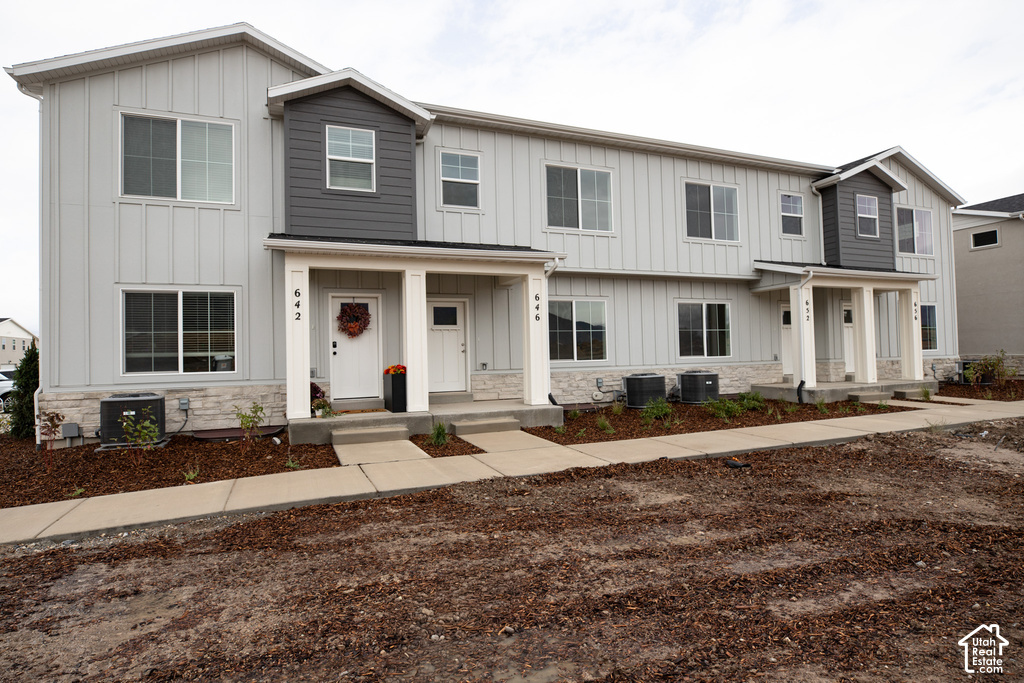
$381,990
646 N 540 E
3 bd · 3 ba · 2,310 sqft
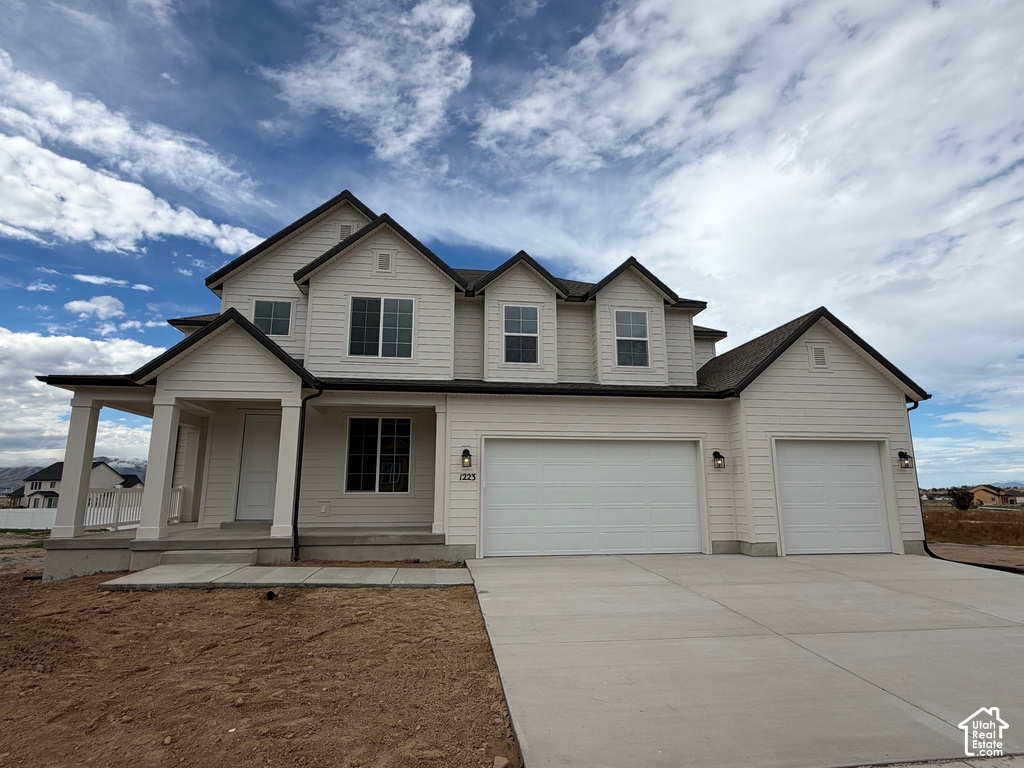
$899,900
1223 N 360 E
5 bd · 4 ba · 5,393 sqft
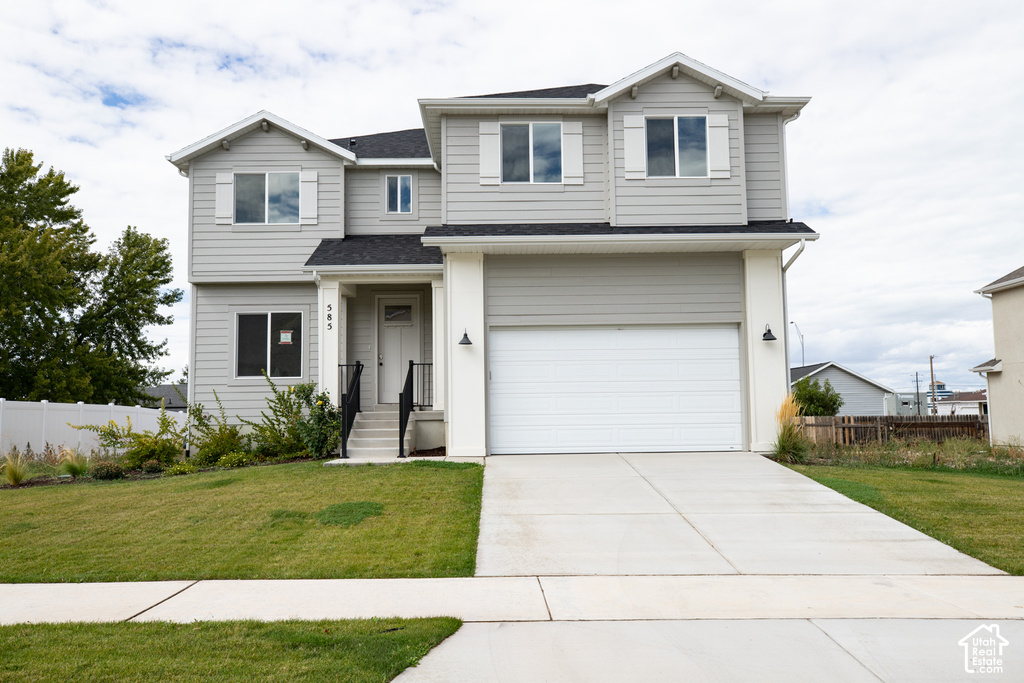
$565,000
585 N 410 E LOT #21 E
4 bd · 3 ba · 3,411 sqft
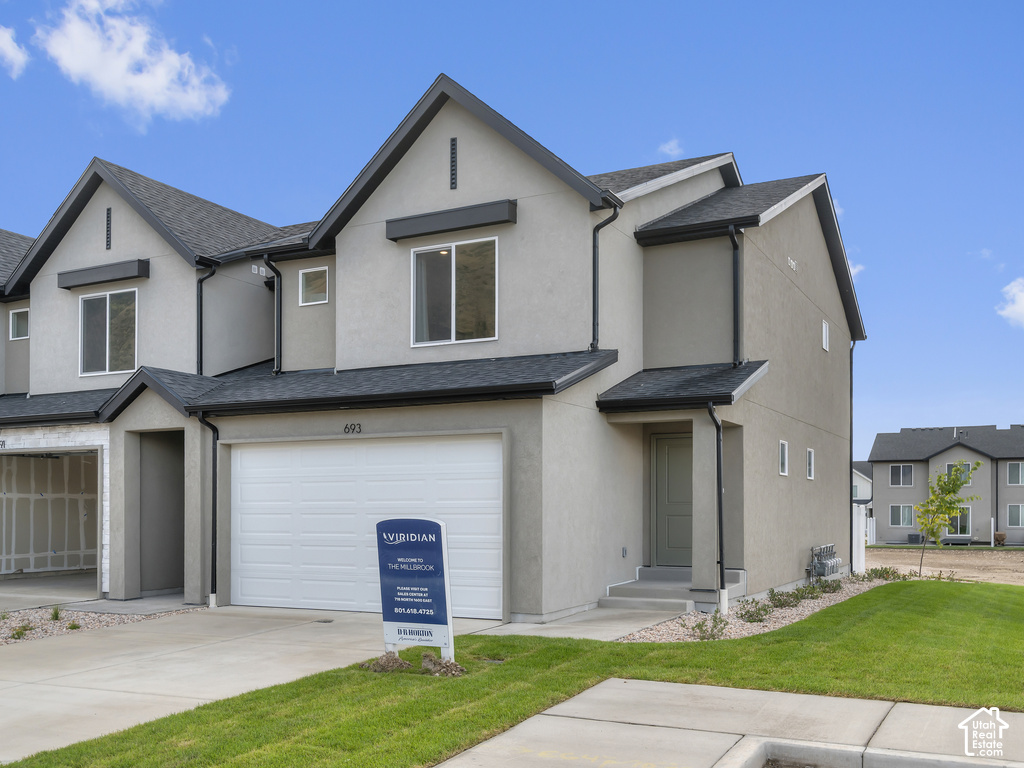
$399,990
1972 E CORRIENTE DR
3 bd · 3 ba · 2,205 sqft
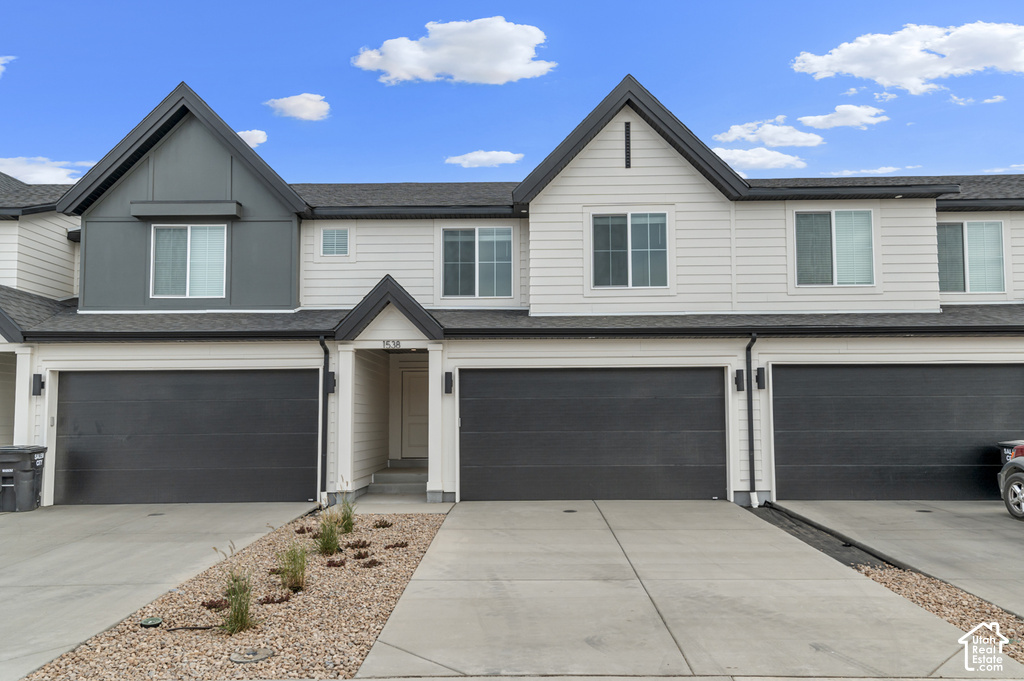
$394,990
1964 E CORRIENTE DR
4 bd · 3 ba · 2,248 sqft
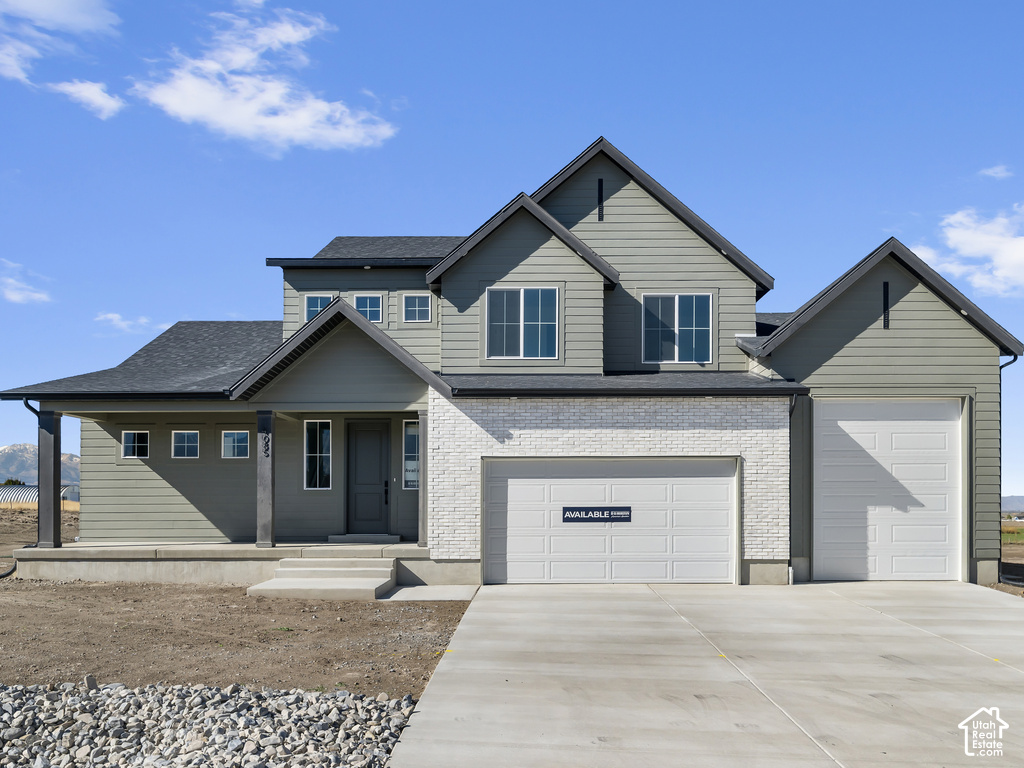
$859,990
1867 E 1060 N
4 bd · 3 ba · 4,332 sqft
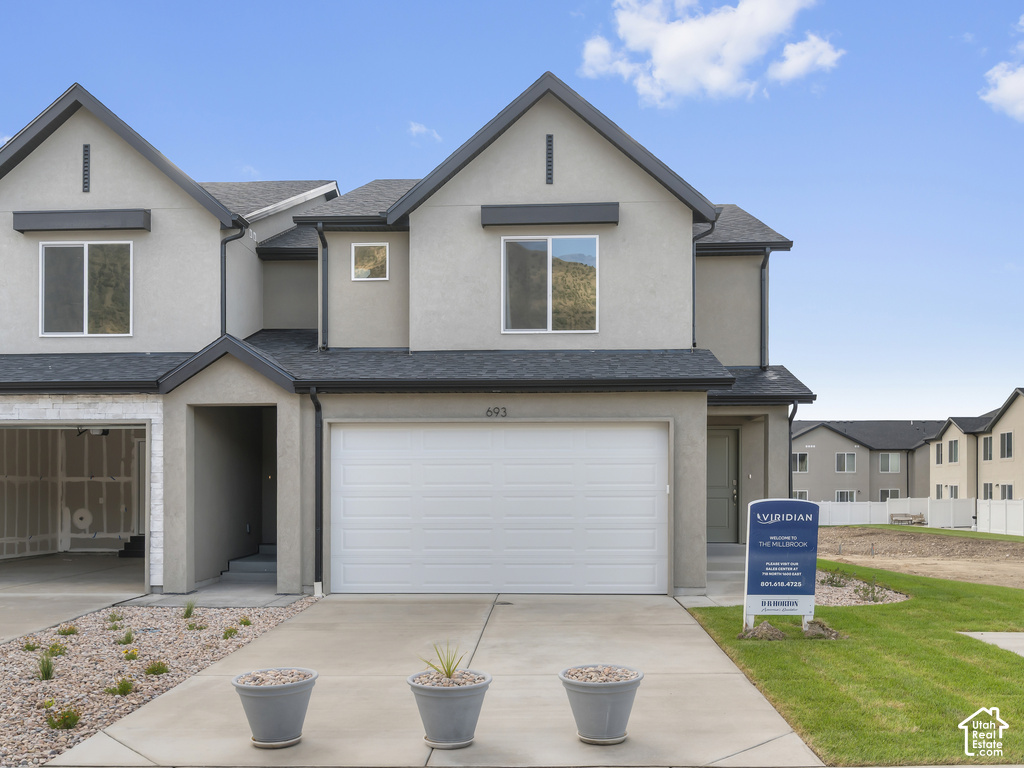
$389,990
1962 E CORRIENTE DR
3 bd · 3 ba · 1,935 sqft
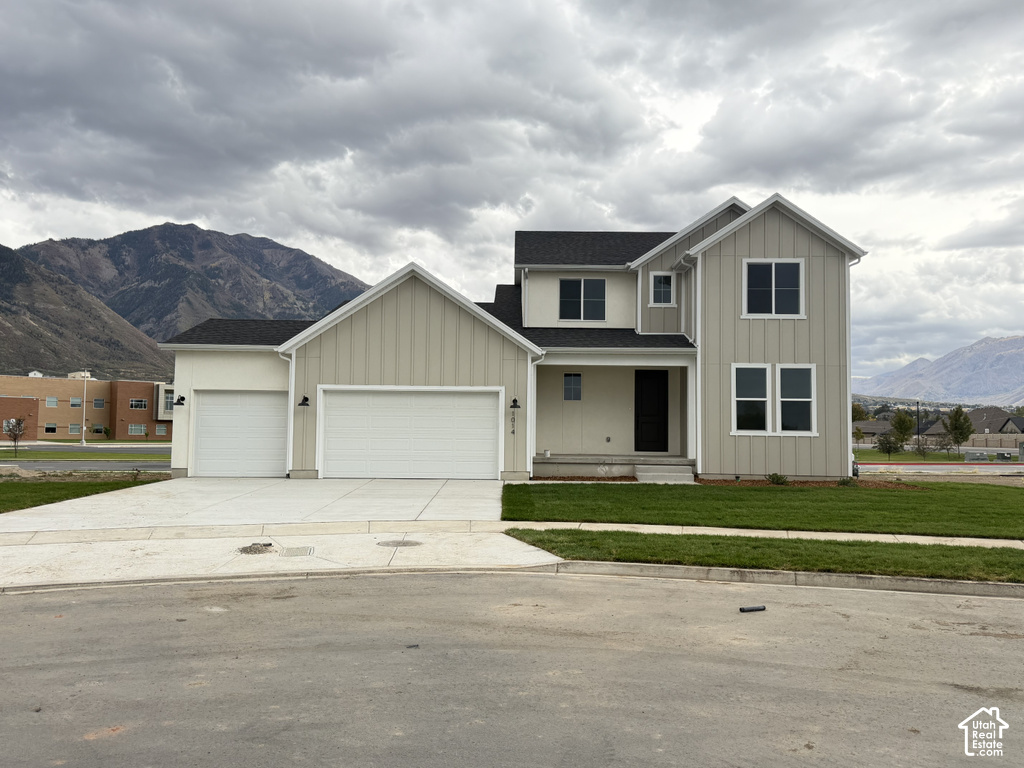
$799,990
1014 E 310 S
4 bd · 3 ba · 4,603 sqft
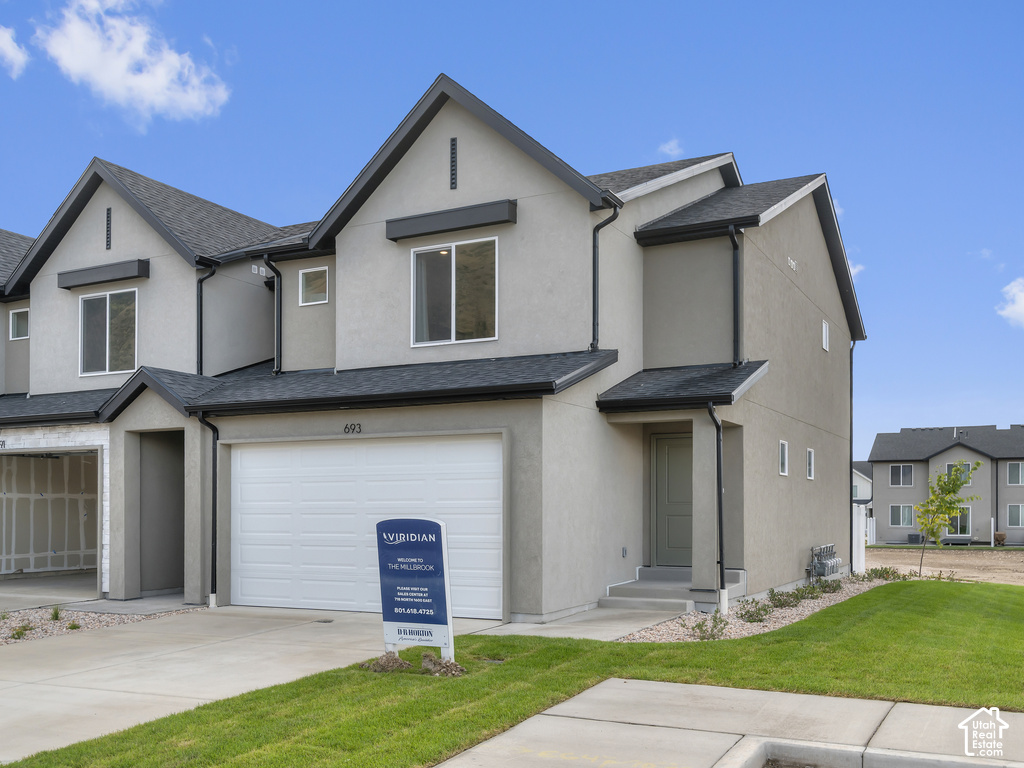
$399,990
1958 E CORRIENTE DR
3 bd · 3 ba · 2,205 sqft
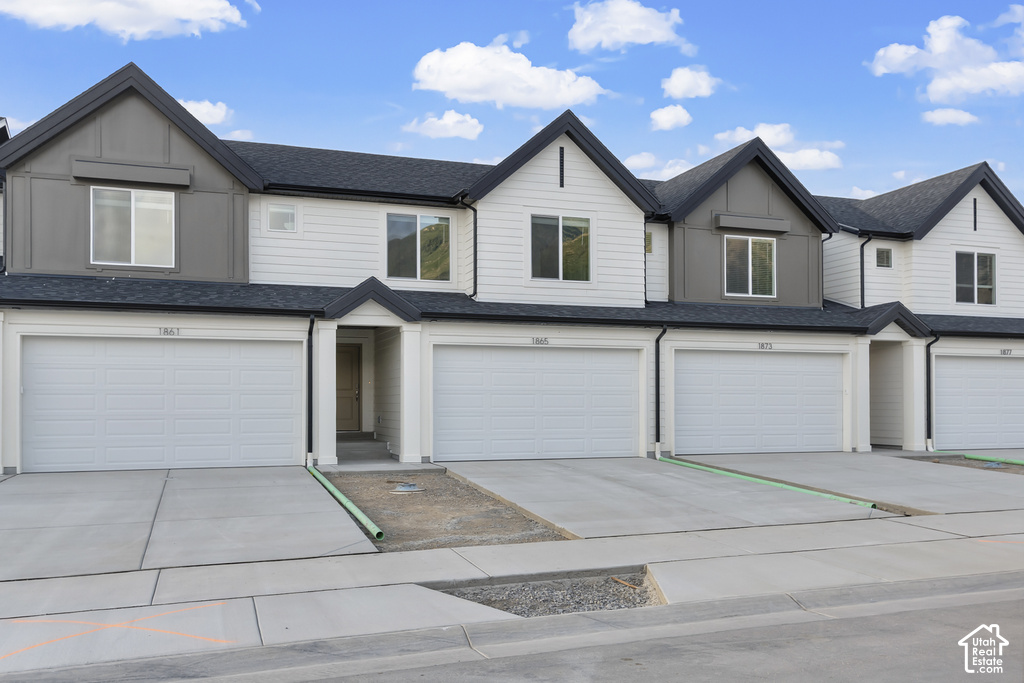
$414,990
1985 E BELMONT LN
4 bd · 3 ba · 2,248 sqft
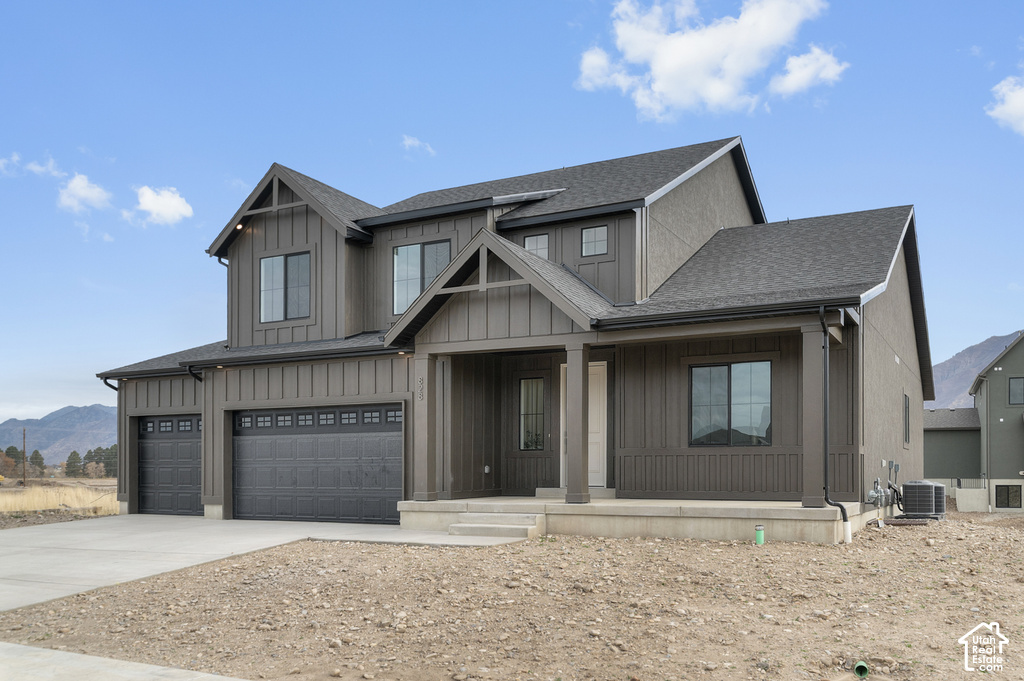
$729,990
1652 E 960 N
4 bd · 3 ba · 4,424 sqft
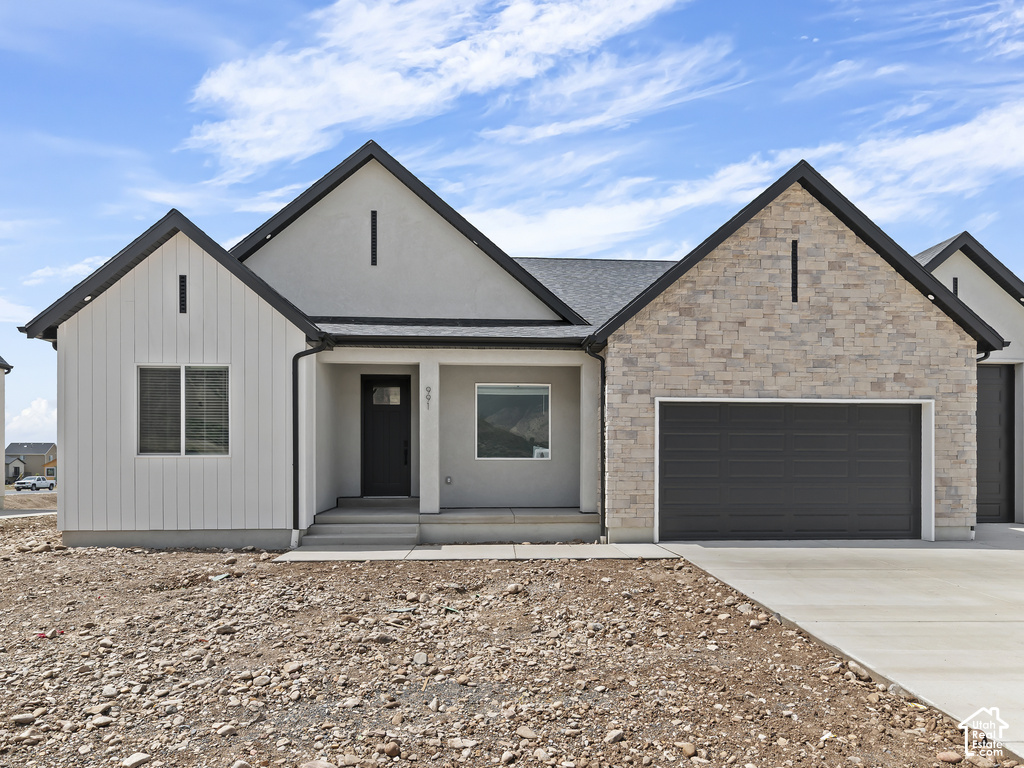
$729,990
1664 E 960 N
3 bd · 3 ba · 4,453 sqft
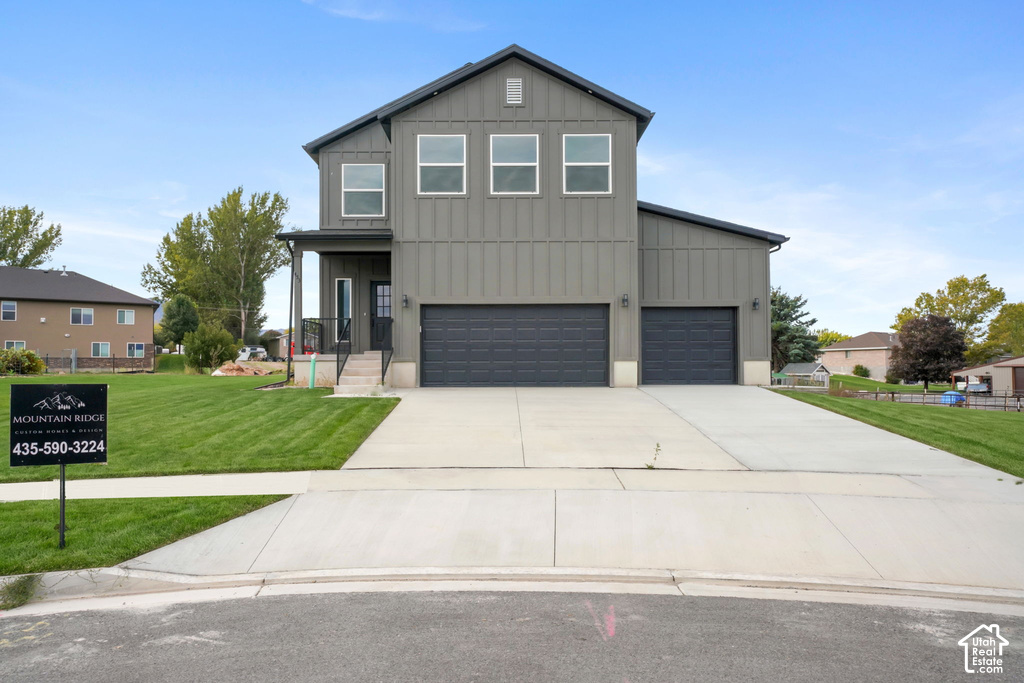
$599,500
453 N 460 E
4 bd · 3 ba · 3,001 sqft
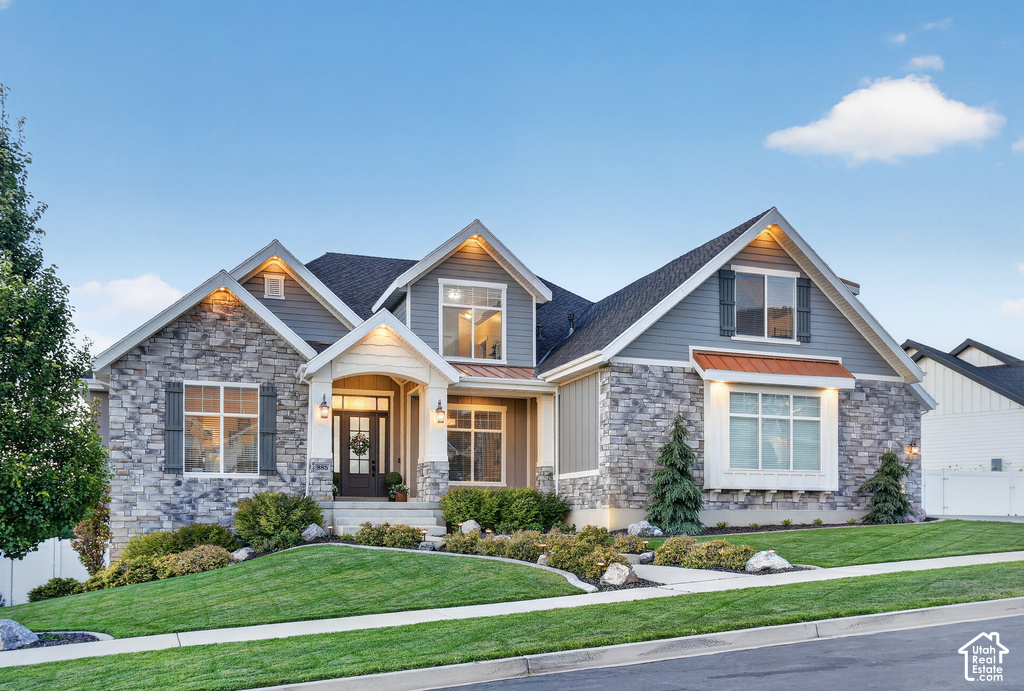
$2.25M
885 E 960 S
7 bd · 6 ba · 7,452 sqft
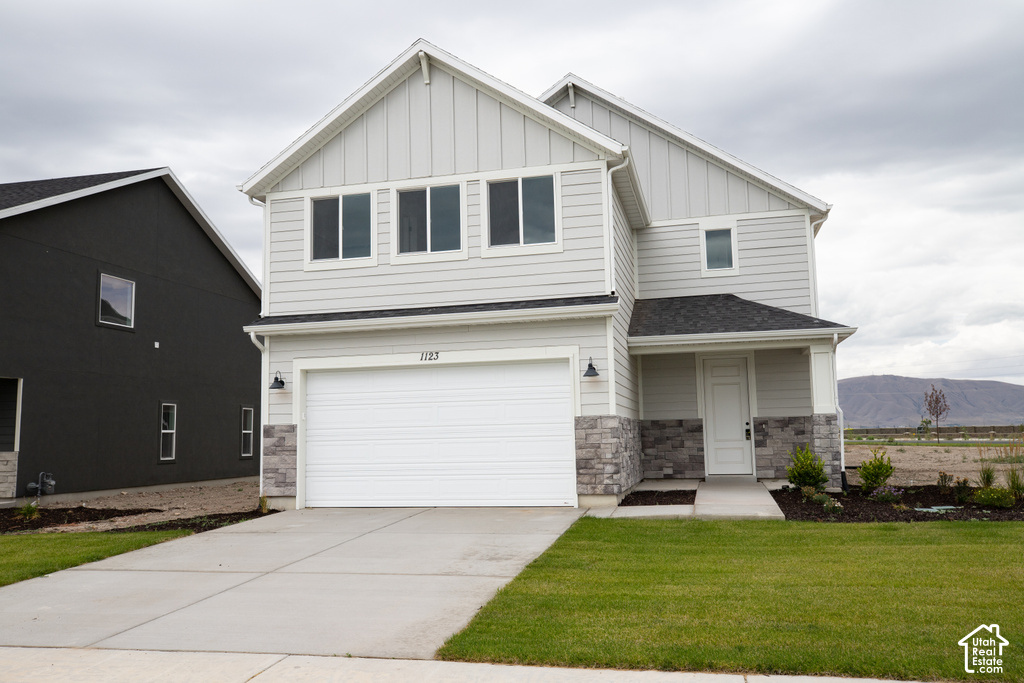
$475,800
1123 N 1060 W LOT #30
4 bd · 3 ba · 2,012 sqft
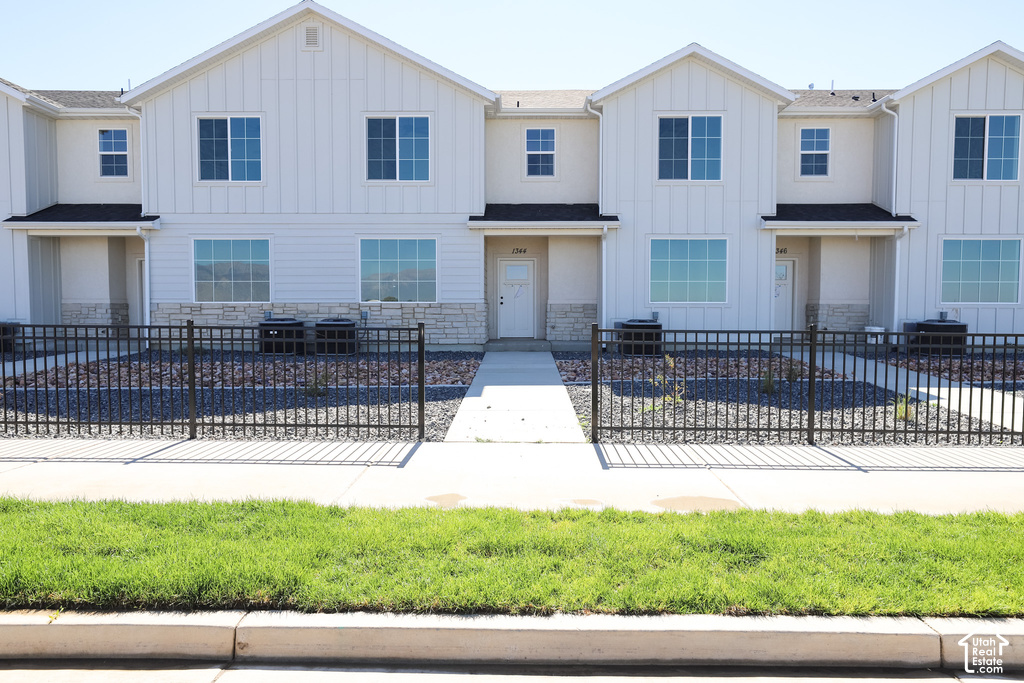
$397,700
1342 W 1290 LOT #134 N
3 bd · 3 ba · 1,672 sqft
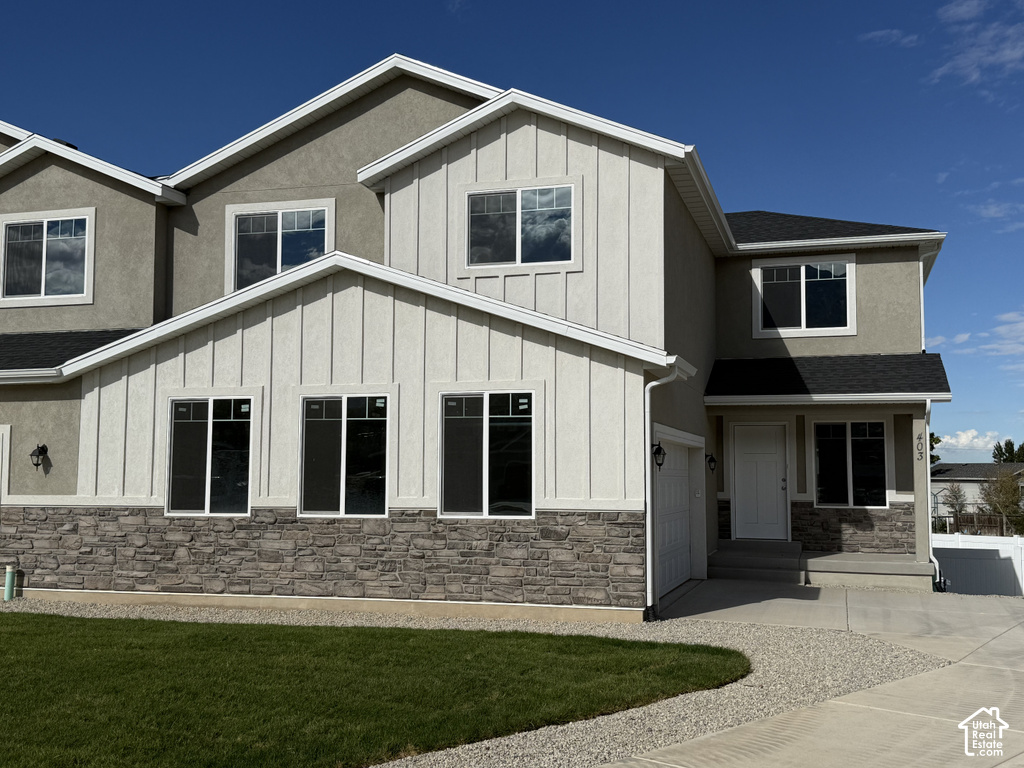
$549,900
403 E 500 N
4 bd · 3 ba · 2,546 sqft
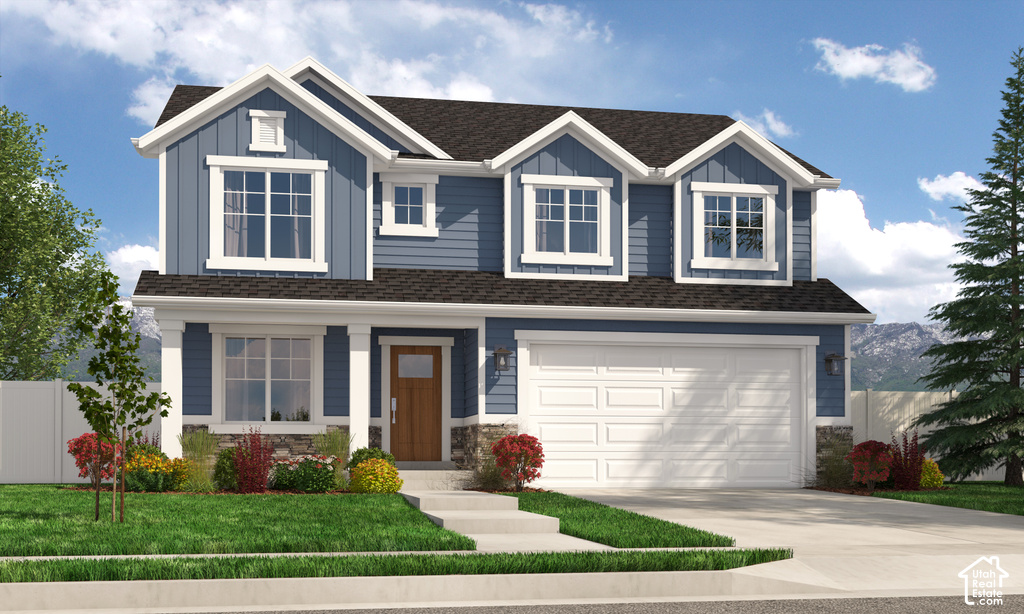
$765,900
1623 S 245 E
4 bd · 3 ba · 3,323 sqft
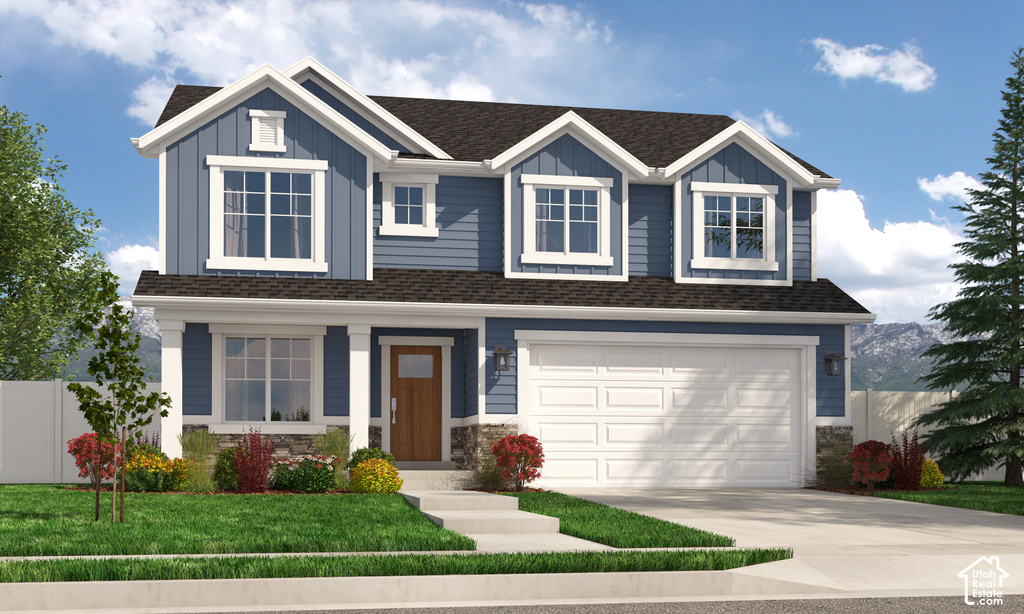
$765,900
1618 S 185 E
4 bd · 3 ba · 3,323 sqft
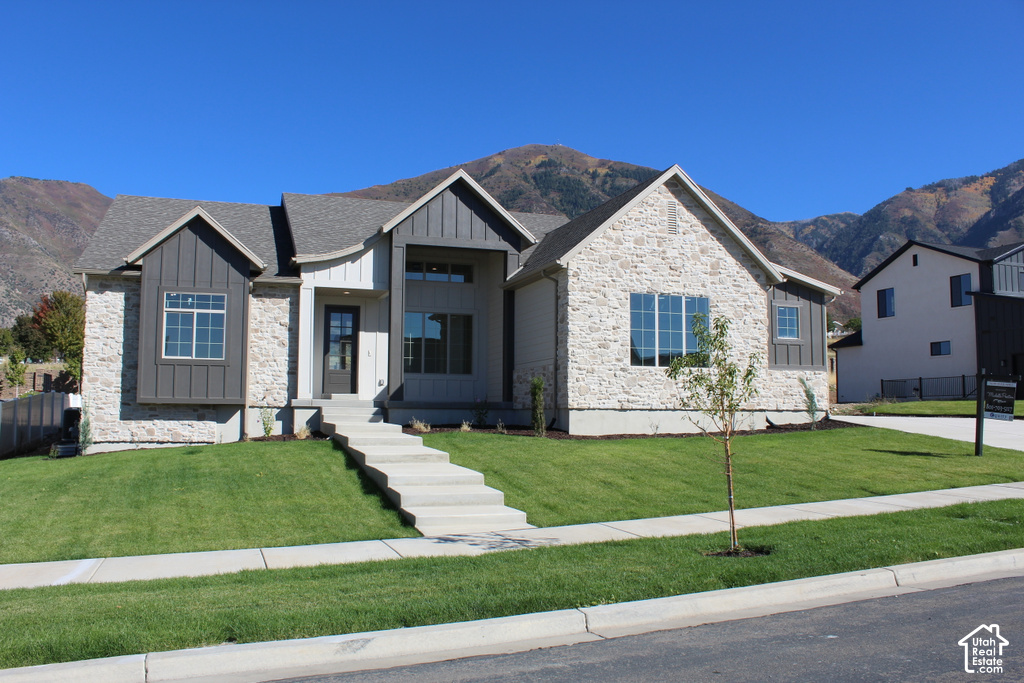
$1.22M
1493 S 920 E
5 bd · 5 ba · 4,550 sqft
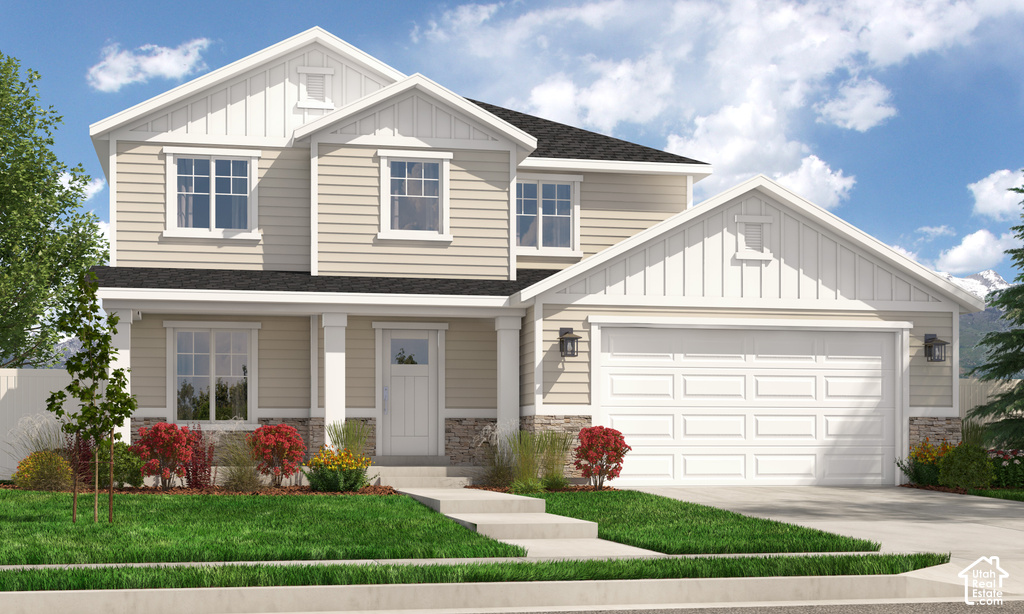
$740,900
207 E 1590 S
4 bd · 3 ba · 3,438 sqft
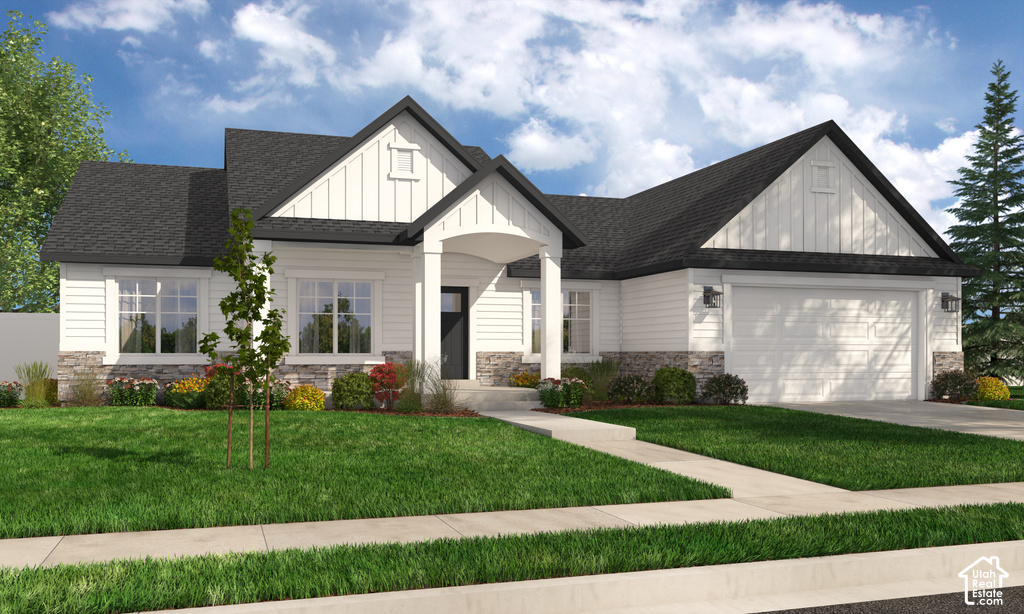
$742,900
173 E 1590 S
3 bd · 3 ba · 3,629 sqft
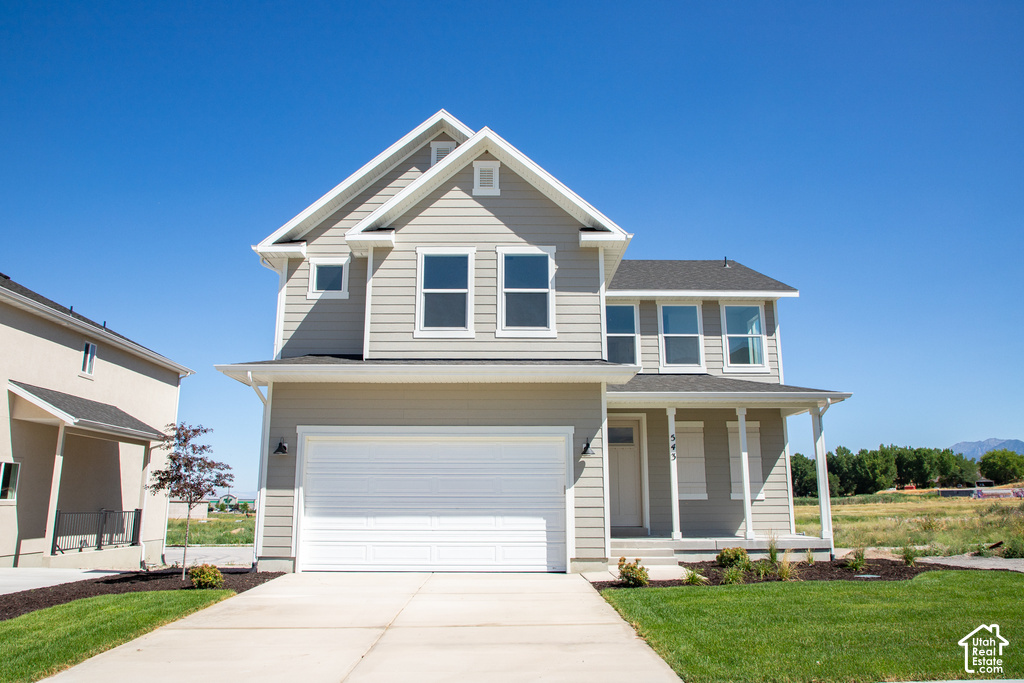
$529,500
543 E 720 N LOT #1
4 bd · 3 ba · 2,882 sqft
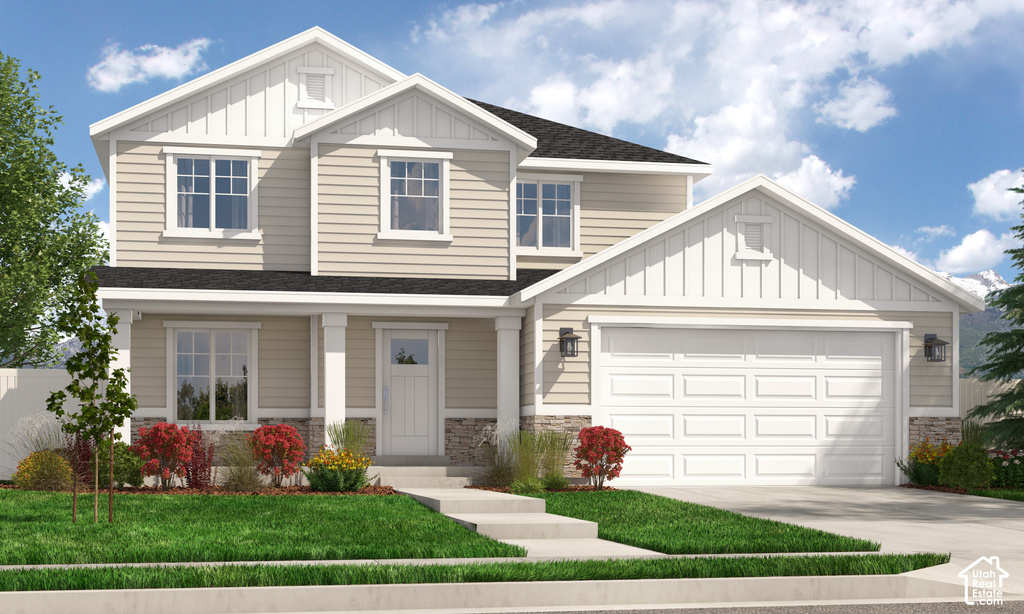
$760,900
1605 S 185 E
4 bd · 3 ba · 3,438 sqft
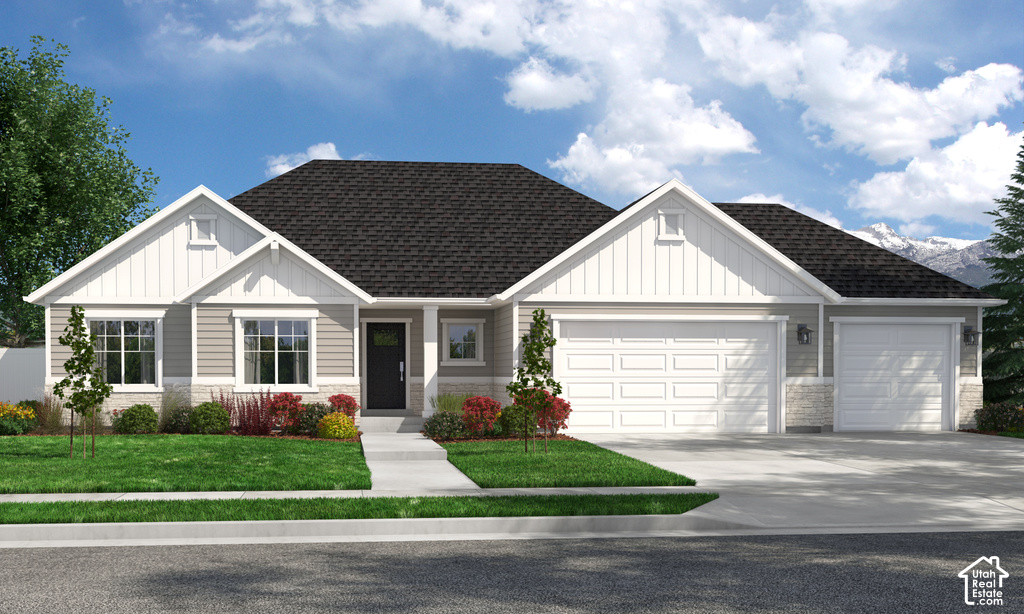
$765,900
1622 S 245 E
3 bd · 3 ba · 3,395 sqft
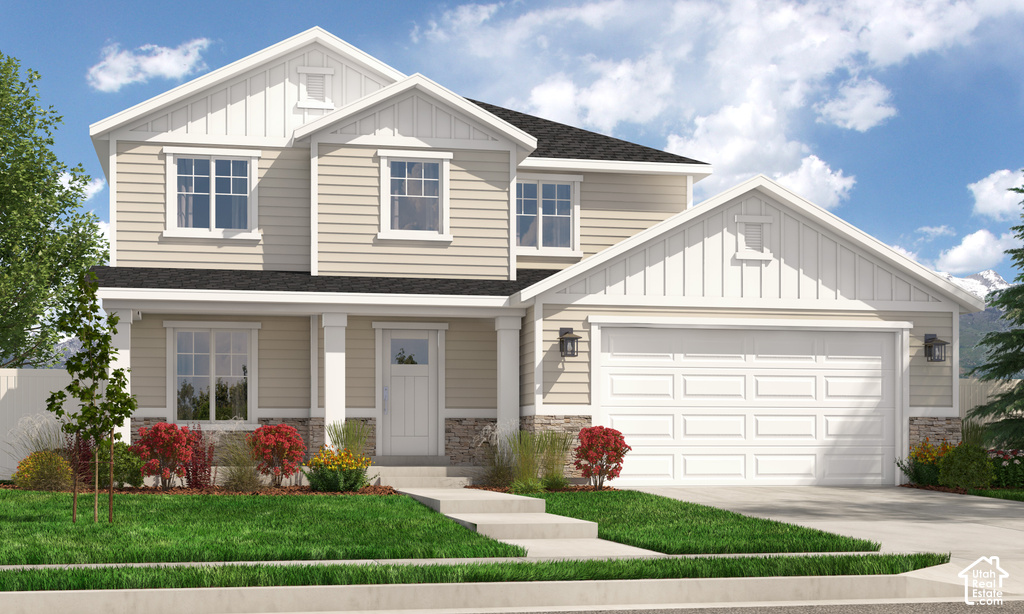
$750,900
1606 S 245 E
4 bd · 3 ba · 3,438 sqft
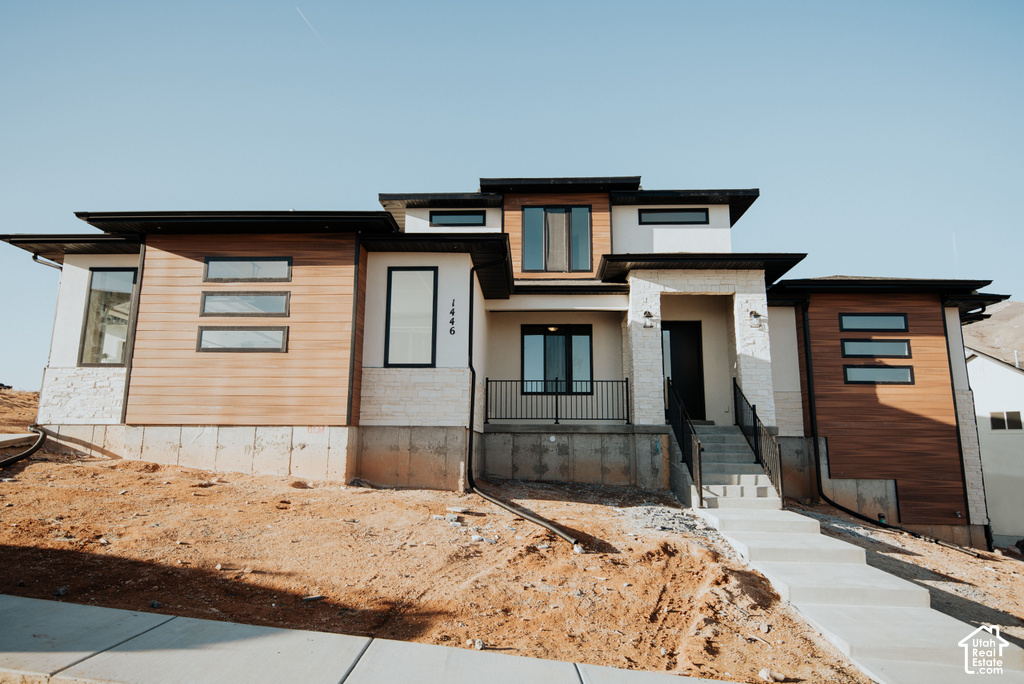
$752,900
1604 S 185 E
3 bd · 3 ba · 3,629 sqft
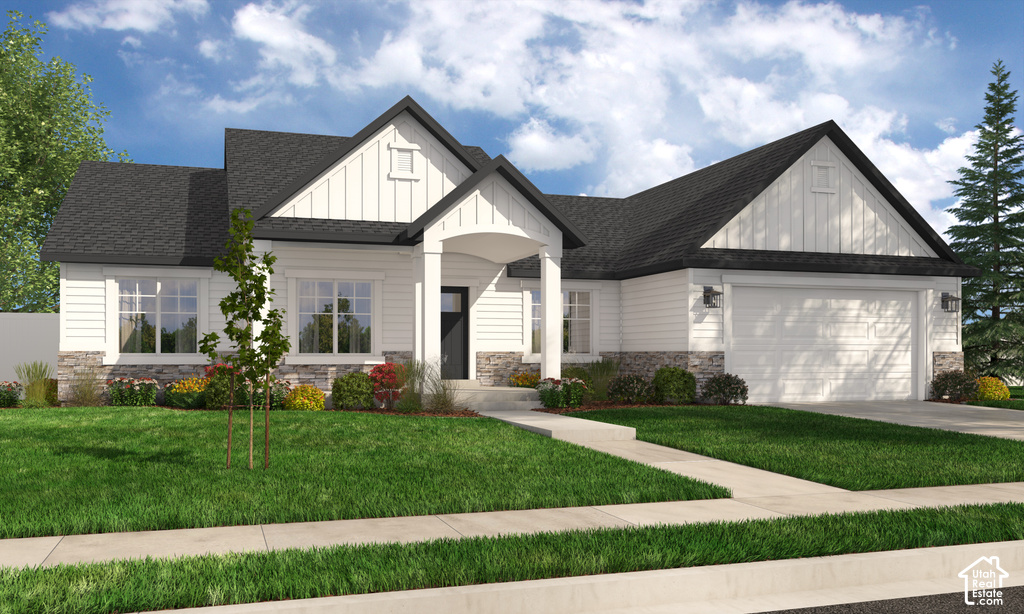
$772,900
1607 S 245 E
3 bd · 3 ba · 3,629 sqft
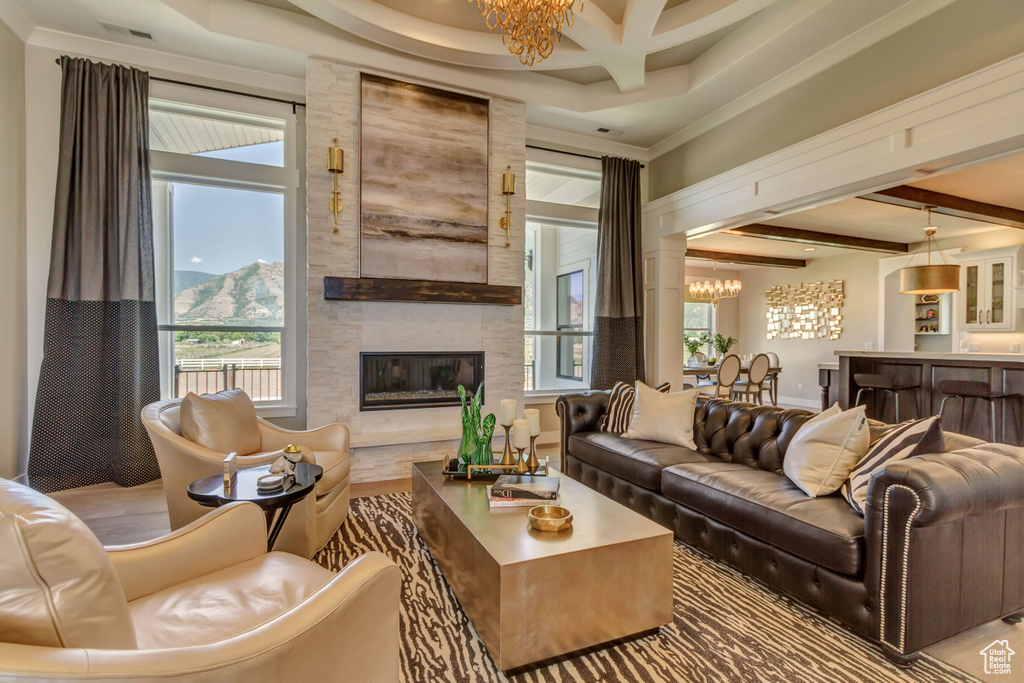
$765,900
1619 S 185 E
3 bd · 3 ba · 3,395 sqft
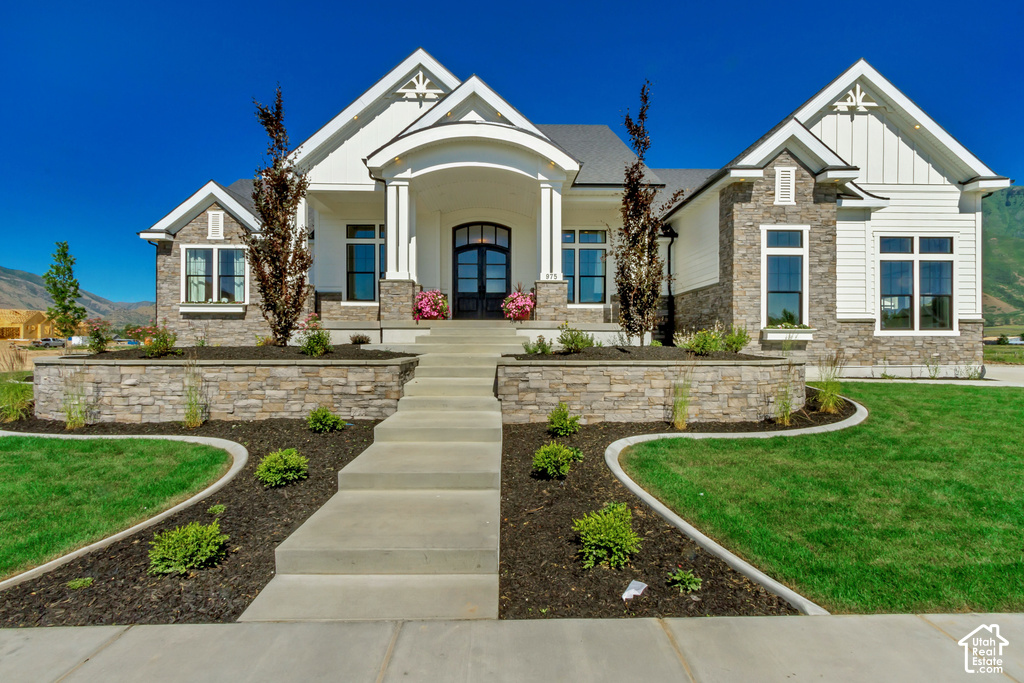
$740,900
227 E 1590 S
4 bd · 3 ba · 3,438 sqft
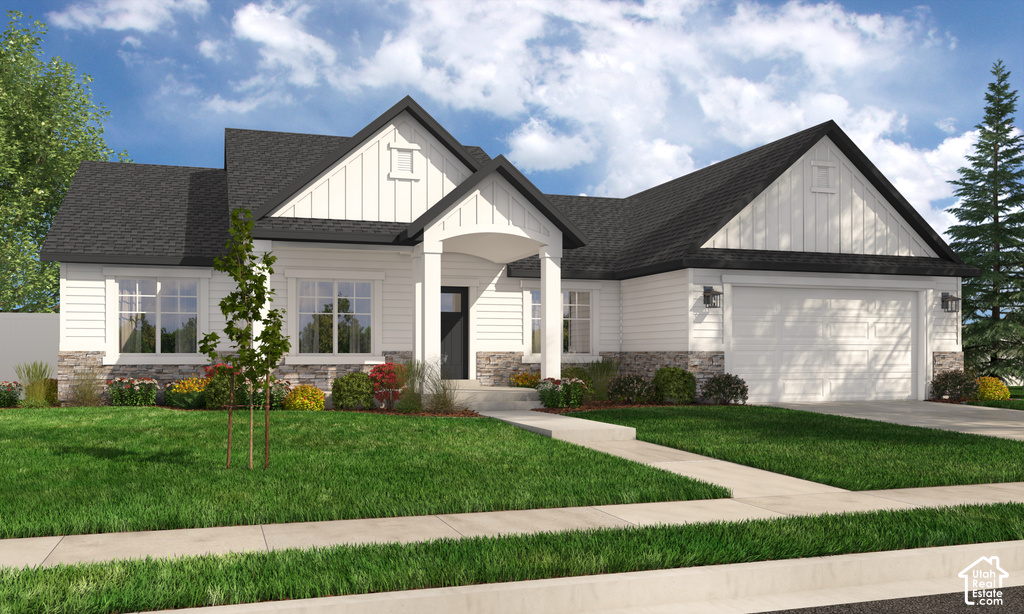
$762,900
239 E 1590 S
3 bd · 3 ba · 3,629 sqft
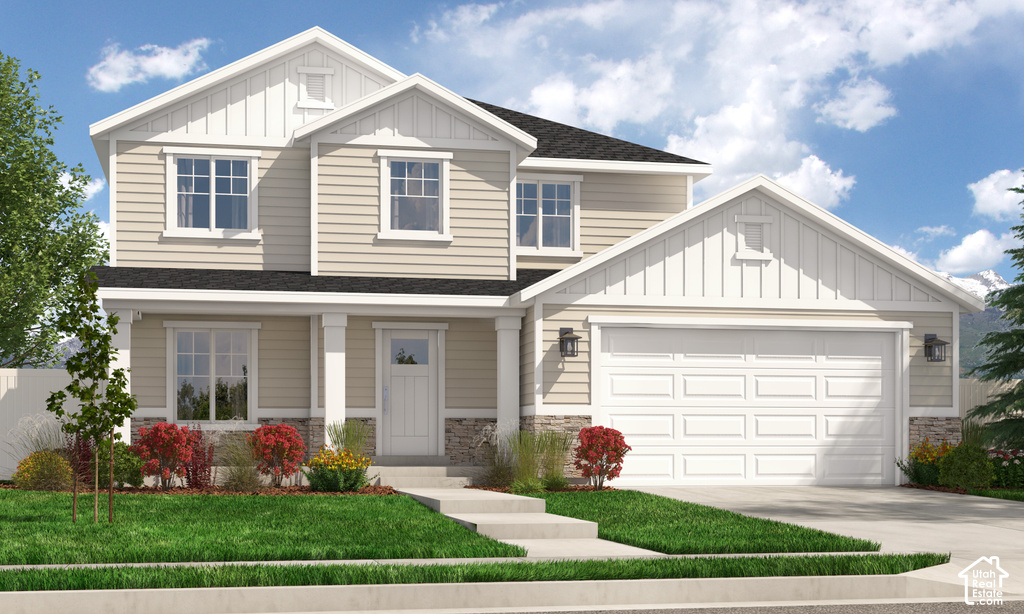
$740,900
153 E 1590 S
4 bd · 3 ba · 3,438 sqft
Salem investment property FAQs
- How many investment properties are listed in Salem?
- There are 132 listings active or under contract in Salem on UtahInvestor.com. This count covers the full local inventory, not just the properties displayed below.
- What is the median investment property price in Salem?
- The median asking price is $590,945 for current listings in Salem. Half of the asking prices fall at or below the median and half at or above it. This is a listing-price measure, not a median closed-sale price.
- What is the average cap rate in Salem?
- An average reported cap rate is not currently available for Salem. Missing cap-rate data does not mean a property has a zero return. Compare income, vacancy and operating expenses using the property analysis guide or our investor tools.